Metatrader: Bollinger Band and Macd
|Bollinger Bands are a technical analysis tool comprised of two bands surrounding a moving average line, one above and the other below. The upper and lower bands are plotted at 2 standard deviations above and below, respectively, the simple moving average. Because a standard deviation is a simple mathematical formula measuring volatility, a contraction in the upper and lower bands means there is less movement in the price, while an expansion in the bands means there is increased uncertainty and a large price movement is more likely.
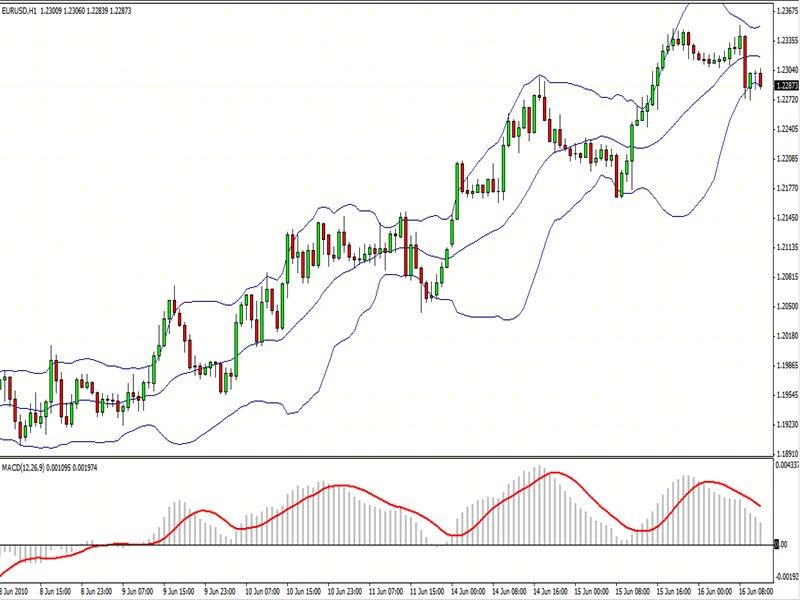
If you plot the Bollinger Bands with your currency pair and the current price of the pair drops to the lower band, it could be taken as a sign of a coming positive reversal in the price. Conversely, if the current price rises to the upper band, it may be taken as a sign the pair is overbought and a fall in price is pending. [As the standard day setting for the moving average is 20 days, setting your Bollinger Bands to 25 days could aid you in counter trading.]
When multiple indicators are used at the same time and they reinforce each other, they can be used to identify high-probability opportunities.
Here we use the MACD (with the setting 12-day EMA and 26-day EMA). The MACD is a trend-following momentum indicator that searches for changes or breaks in a trend, just like the Bollinger Bands. The MACD can be used to ascertain whether the price is at a top or bottom. If the price of a currency pair falls to the lower Bollinger Band, you can take a look at the MACD to provide more proof of whether a price reversal is on the way or not. If the MACD is relatively low and starts to rise, a price reversal is more likely and you have reached a possible buying point.
You could also look at your moving averages for more proof. An EMA crossover, when the shorter (or faster) moving average crosses above the the longer (slower) moving average, provides additional comfort that a bull movement is coming.
In the contrary case, if the price of your currency pair rises to the upper Bollinger Band and the MACD is considerably high and starts to drop, a downward movement in the pair is more likely.
You should look to your Bollinger Bands before checking the MACD for confirmation of a break in trend. Vice versa the signal is not as effective because the MACD is a lagging indicator, meaning a significant move may have already occurred and you may enter your position too late. Look for breaks in trends using the Bollinger Band first, and then confirm it from the MACD.
Note
When the market moves sideways, or non-directionally, the MACD does not give a good performance.
------
Related resources:
Information on these pages contains forward-looking statements that involve risks and uncertainties. Markets and instruments profiled on this page are for informational purposes only and should not in any way come across as a recommendation to buy or sell in these assets. You should do your own thorough research before making any investment decisions. FXStreet does not in any way guarantee that this information is free from mistakes, errors, or material misstatements. It also does not guarantee that this information is of a timely nature. Investing in Open Markets involves a great deal of risk, including the loss of all or a portion of your investment, as well as emotional distress. All risks, losses and costs associated with investing, including total loss of principal, are your responsibility. The views and opinions expressed in this article are those of the authors and do not necessarily reflect the official policy or position of FXStreet nor its advertisers.