Options – Picture This (Part 2)
|My last article was the first in a series on the Option Payoff Graph, or Risk Graph. Today we continue with that.
Our example was a neutral-to-bullish option trade on General Electric stock. We actually began this example in an article on types of options expiration dates a few weeks ago and, so far, GE is still hanging in there.
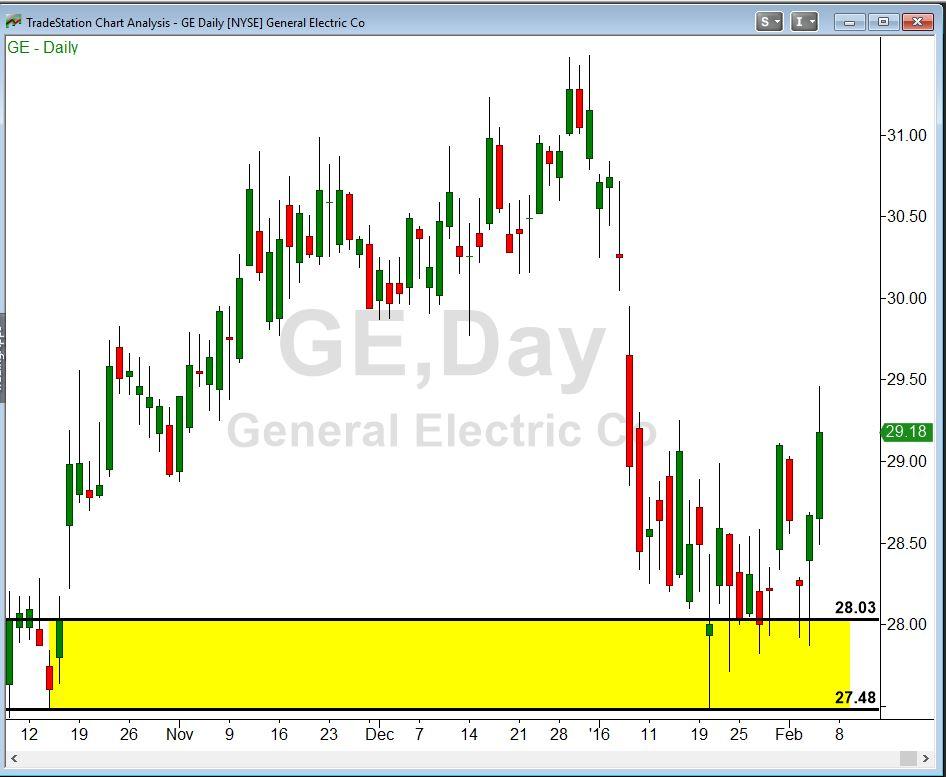
Here is what the GE chart looked like on February 4:
We expected GE to reverse out of the demand zone created last October in the range from $27.48 to $28.03. A week ago, we could have sold the GE February puts at the $27 strike price for $.39 per share, or $39 per contract.
In last week’s article, we showed the option payoff graph for that option trade. Here we update that to show it as of now, with some additions:
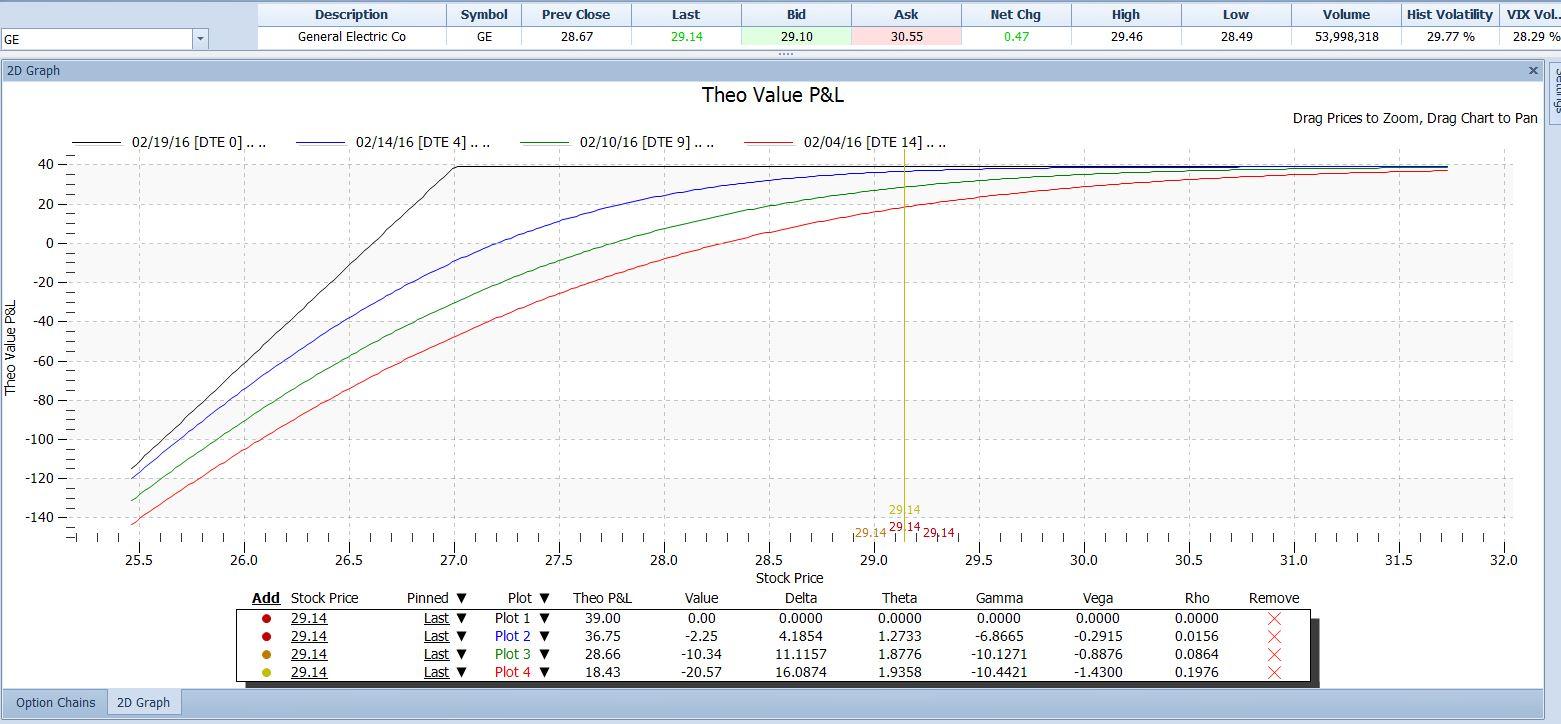
Last week we only showed the one gray line, which represents the profit or loss on this trade at the displayed stock prices if we held that position until the puts expired.
Today we’ve added three more lines (the blue, green and red ones) which show the profit or loss at different dates in the future. The red one is as of today, February 4, at which time there were 14 days to expiration. The green line is as of February 10, when there will be nine days to go. And, the blue line is as of February 14, when there will be just four days to go.
The straight gray lines, as stated above, represent the profit at any stock price on the expiration date. At that time, the option will have a value exactly equal to its intrinsic value – the amount by which the stock has fallen below the $27 strike price, if any. If the stock is not below $27 at that time, the position will be worthless. That is what we want since we have sold the option short. We would then not have to pay anything to extract ourselves from the option trade, and we would keep the $39 we received for selling the put. That is why the gray line is horizontal at a height of $39 at all stock prices at or above $27. It slopes downward to the left at stock prices below $27, which reflects the fact that if the stock is lower than $27, the puts will have value and we would have to pay that value. That reduces our profit.
The red, green and blue lines show how the profit picture changes from day to day. At the time this graph was drawn, GE stock was at $29.14. If we were to close out the position right now, we would have to pay $.205 per share for the puts, or $20.50 for the contract. The option still has that $20 value because in the remaining 14 days of its life GE could still drop below $27.
With every passing day that gets less likely; and so the value of the option declines. At four days to go (the blue line), if the stock were still at $29.14 there would be virtually no chance that it could drop as low as $27, so the value of the put would be next to zero. The blue line indicates that the option would be worth just $.0225 per share at that point, giving us almost all of our profit.
The table at the bottom of the graph allows us to specify different stock prices and/or different future dates so we can evaluate how our position’s profit will evolve.
The graph and its P/L estimates are an essential part of an option trader’s toolkit. Take the time to learn how yours works and it will pay you back many times over.
Information on these pages contains forward-looking statements that involve risks and uncertainties. Markets and instruments profiled on this page are for informational purposes only and should not in any way come across as a recommendation to buy or sell in these assets. You should do your own thorough research before making any investment decisions. FXStreet does not in any way guarantee that this information is free from mistakes, errors, or material misstatements. It also does not guarantee that this information is of a timely nature. Investing in Open Markets involves a great deal of risk, including the loss of all or a portion of your investment, as well as emotional distress. All risks, losses and costs associated with investing, including total loss of principal, are your responsibility. The views and opinions expressed in this article are those of the authors and do not necessarily reflect the official policy or position of FXStreet nor its advertisers.