Options – Looking for Trades in All the Right Places
|When looking for opportunities for option trades we need to locate situations where we can profit from at least one of the three option profit centers: underlying price movement, time decay, and implied volatility changes.
There are at least two ways we can approach this.
1. We can give priority to the price-movement dimension by first identifying an underlying asset (stock, ETF, index or futures contract) about whose price movement in the near future we have a strong opinion. That opinion can be that the stock is most likely to go up, down, sideways or explosively in an unknown direction. This identification is made in the same way that we would do it for a trade of the underlying itself, by scanning charts of a familiar list of candidates and/or by using computerized scanning aids.
With this step done, we now know what price behavior of the underlying we will set ourselves up to benefit from. That is, whether we will set up a trade that is bullish, bearish or neutral as to price.
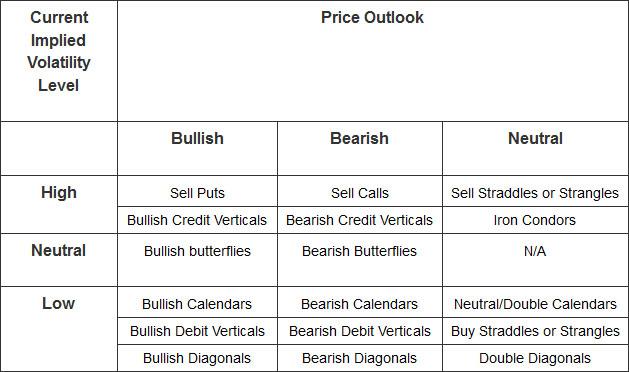
After identifying the underlying and its expected price direction in this way, our secondary task is to assess the asset’s implied volatility situation. Implied volatility measures whether the options are currently inflated, deflated or fairly priced for this particular asset. Once we know this, we can then determine what particular option strategy to use. If implied volatility is high (options are expensive and, therefore, most likely to deflate from here) we’ll choose a strategy that benefits from a drop in implied volatility – we will be net sellers of time value. Conversely, if implied volatility is low we will be net buyers of time value so that a re-inflation of the options we own will help us. Here are a selected few of the many strategies from which we could choose based on our two-dimensional assessment:
The implementation of strategies like these and others are covered in our Professional Options Trading course. The purpose of this article is just to discuss our selection process.
2. An alternative approach is to come at this the other way around – strategy first, then implied volatility and price behavior last. In this approach, we first determine what strategy we would like to use. All can work well in their proper price/volatility environments; but we may have specific ones that we favor out of personal preference. We also may be limited in our selection by the options approval level given to us by our broker. New traders or those with smaller brokerage accounts will have approval to trade fewer strategies.
In this strategy-first approach we pick our strategy first. Let’s say that we want to buy puts because we believe that in general the equity markets are against major highs and most likely to decline.
Looking at our table we see that buying puts is a bearish strategy (that’s why we picked it) that is best done when Implied Volatility is low.
So our first screening task is to scan for, or otherwise identify, underlying assets which are currently at volatility levels that are low (for them). We will now have a small list of candidates. From this list we then hone in on the ones that seem to be in the best situation for a near-term drop by examining their price charts. We can also use the scanning process to help with filtering in only stocks that have recently been moving strongly upward.
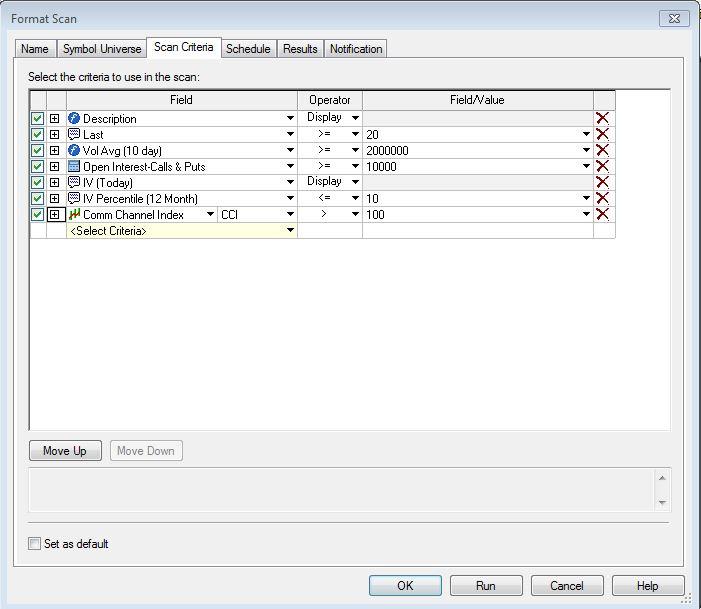
For this two-pronged scanning process, many trading platforms and some other third-party software vendors have good tools. The example shown below is from the TradeStation trading and analysis platform. This shows a scan for put buying candidates:
Here are the elements of this scan:
Description – display only. This tells us the name of the stock, rather than just its symbol.
Last Price >= 20. Filters out low-priced stocks whose movements tend to be more erratic.
Daily Volume Average (over 10 days) >= 2,000,000. Filters out thinly traded stocks.
Open Interest – Calls & Puts >=10,000. Filters out stocks with very little option activity.
Implied Volatility Today – display only. Shows current IV level.
IV Percentile (12 Month) <= 10. Returns only stocks whose current IV is in the bottom 10% of the range of their IV level over the past year. This is the guts of this scan – identifies low-IV stocks.
Commodity Channel Index > 100. This is a momentum scan which identifies stocks that have recently been moving far and fast to the upside. It is one of many indicators that could be used for this purpose. The idea is that this upward movement may have brought them into a good supply zone from where we can have confidence that they are most likely to drop. Whether in fact the stock is in a good supply zone can only be determined by proper chart analysis, which is our next step.
A scan like this will narrow down the universe of stocks to a manageable number. On this date it returned a list of eleven stocks. It was then quick work to review these few charts and identify the two or three that looked like legitimate put-buying candidates.
In summary, each options strategy works best in its appropriate price/volatility environment. We need to match the specific situation to the best strategy. We can do this by approaching it from the price standpoint first, with volatility secondary; or from the volatility side first, and then check for good price situations. Either way is valid, although the volatility-first scan will generally be quicker overall because the labor-intensive task of analyzing charts will be done on fewer candidates.
Information on these pages contains forward-looking statements that involve risks and uncertainties. Markets and instruments profiled on this page are for informational purposes only and should not in any way come across as a recommendation to buy or sell in these assets. You should do your own thorough research before making any investment decisions. FXStreet does not in any way guarantee that this information is free from mistakes, errors, or material misstatements. It also does not guarantee that this information is of a timely nature. Investing in Open Markets involves a great deal of risk, including the loss of all or a portion of your investment, as well as emotional distress. All risks, losses and costs associated with investing, including total loss of principal, are your responsibility. The views and opinions expressed in this article are those of the authors and do not necessarily reflect the official policy or position of FXStreet nor its advertisers.