Picturing Option Profits to Make Money in the Stock Market – Part 3
|I’ve been writing about using Option Payoff Diagrams in the last two articles (Part 1 and Part 2). We’ll extend that discussion today.
Last week I wrote about an example of a covered call position in Apple Computer. I showed the payoff diagram for the stock alone, which at that time was at $102.39. I also showed a diagram for a short call at the $105 strike price; and for a combination of the two. That combination is the covered call.
Below are those diagrams. They show the profit and loss on the indicated position (vertical scale), for any stock price (horizontal scale). The diagram for the stock position is applicable at any point in time, since a stock position never expires. Options, however, do expire. The diagrams that include any option position apply only at a specific moment in time. On these figures, that moment is at the expiration of the option.
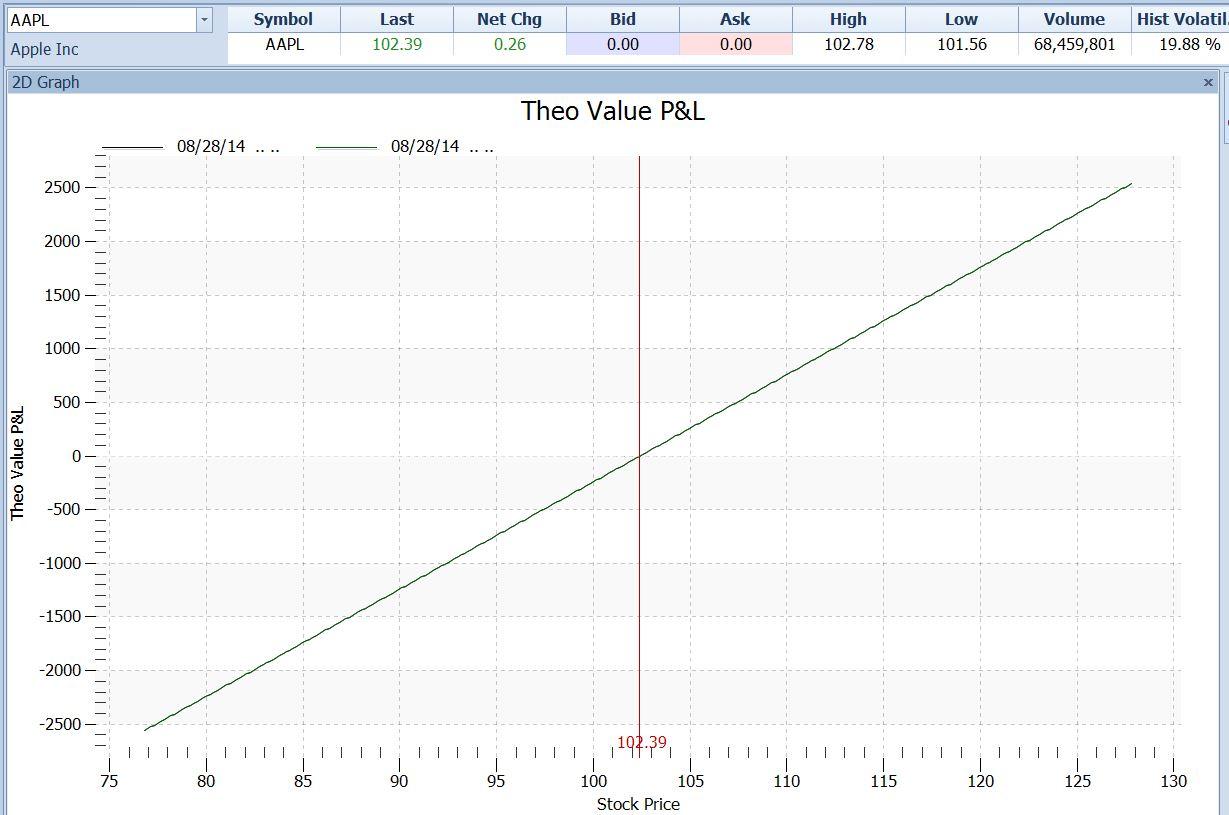
Figure 1 – Option Payoff diagram – AAPL stock
Above is the diagram for a position composed of 100 shares of the Apple stock alone, if purchased at $102.39. Profit is on the vertical scale, labeled “Theo Value P&L” at the left. Stock price is on the horizontal scale, labeled at the bottom.
Next, let’s review the diagram for a position consisting of one short call option at the $100 strike price. This position is for a naked call, which means that the call seller does not own the stock that the call applies to.
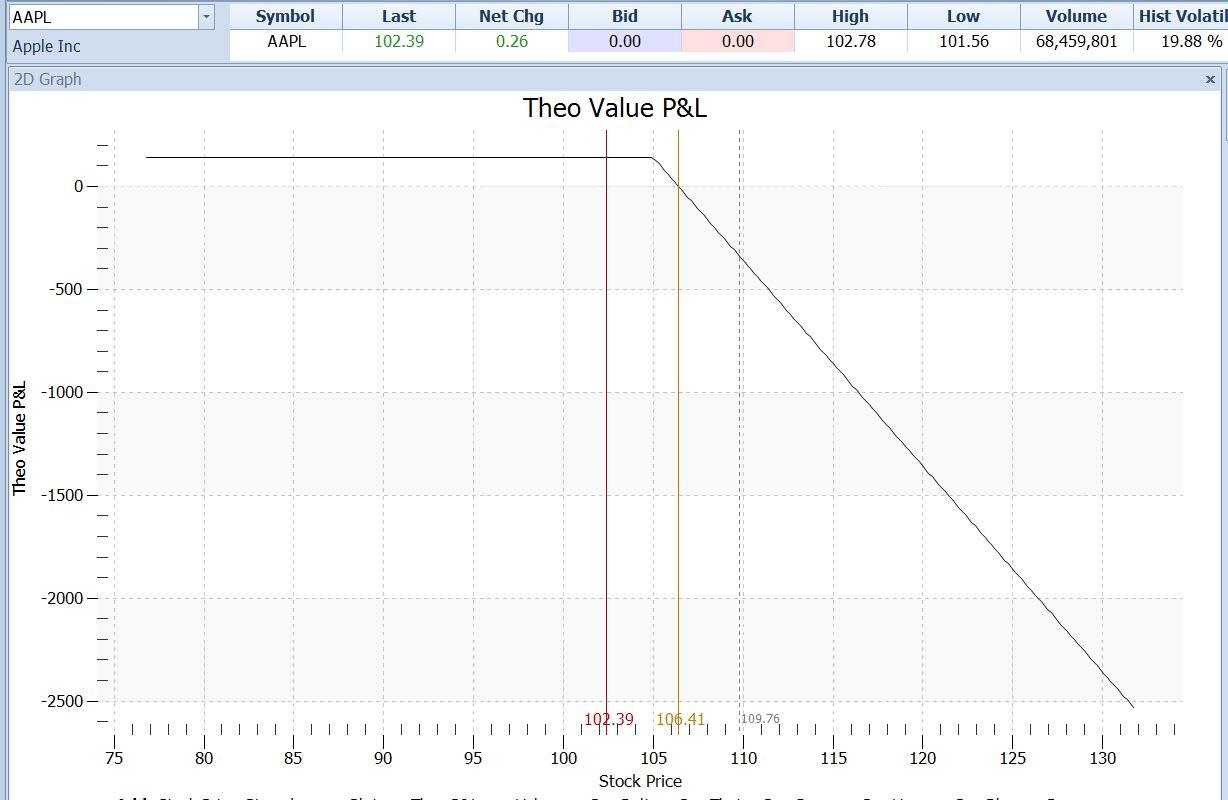
Figure 2 – Option Payoff diagram – Short AAPL Sep 105 Call (alone – no stock position)
The above diagram shows the payoff on a short call position at the $105 strike, where the call was sold at $1.41 per share, or $141 for the contract. Note that the call seller makes the maximum profit of $141 (on the left scale, specific value not marked) when Apple’s stock price at the time of expiration is anywhere below $105. In that case, the option will not be exercised, and the option seller’s obligation to sell the stock terminates. We say that the call has expired worthless. The seller then has earned the full $141 premium as his profit.
If Apple is at any price above $105 at expiration, the call option will not be worthless at that time. It will have value equal to the stock price minus the $105 strike price. If Apple at that time were to be at $106.41, for example, the value of the call would be $106.41 (stock price) minus $105 (strike price), or $1.41 per share. We call this $1.41 the intrinsic value of the call. It is also referred to as the amount by which the call is in the money.
The $105 call would certainly be exercised in that case. That means that every call buyer (the person on the opposite side of this trade) would hand over $105 X 100 shares = $10,500 to every call seller. Every call seller would hand over 100 shares of Apple stock in exchange. This automatic exercise happens at expiration to every single outstanding in-the-money option, whether either side wants it to happen or not. The options clearing house, in cooperation with the investors’ brokers, does these transactions.
So our option seller knows to a certainty that if the price of Apple is anywhere above $105 at expiration, he will have to sell Apple’s stock at $105. That was the obligation he took on by selling the call. Since in this case he was naked, and does not own any Apple stock, he will have to buy it at the going market price at expiration, in order to hand the stock over to the call buyer. He will be selling that stock at a fixed price of $105 no matter what he has to pay for it. So he will have a loss on the stock equal to the amount by which its price at that time exceeds $105 – in other words his loss on the stock will equal the intrinsic value of the call. In this case that is $1.41 per share, or $141 on the contract.
Since the call seller earlier received $141 for selling the contract, his $141 loss on the stock absorbs that entire amount, and the option seller breaks even. We can calculate the break-even price for any short call position as the strike price ($105) plus the call premium ($1.41).
In the diagram above the gold vertical line, which is set at the breakeven stock price of $106.41, cuts the dark P&L line at the point where the P&L line’s vertical reading is zero – a break-even situation.
Above $106.41, the P&L line has increasingly negative values, indicating larger and larger losses for the call seller. There is no theoretical limit to the amount of his losses.
However, there is nothing to prevent the call seller from taking on another position that will put a limit on his losses. One simple way to do that would be to simultaneously buy the Apple stock today at its current price of $102.39. In that case, his short call would not be naked - it would be covered. In the event that Apple did end up at expiration above $105, the call seller would not have to buy it at the market price; he already owns it. His obligation to deliver the stock to the call buyer, therefore is covered by his existing stock position.
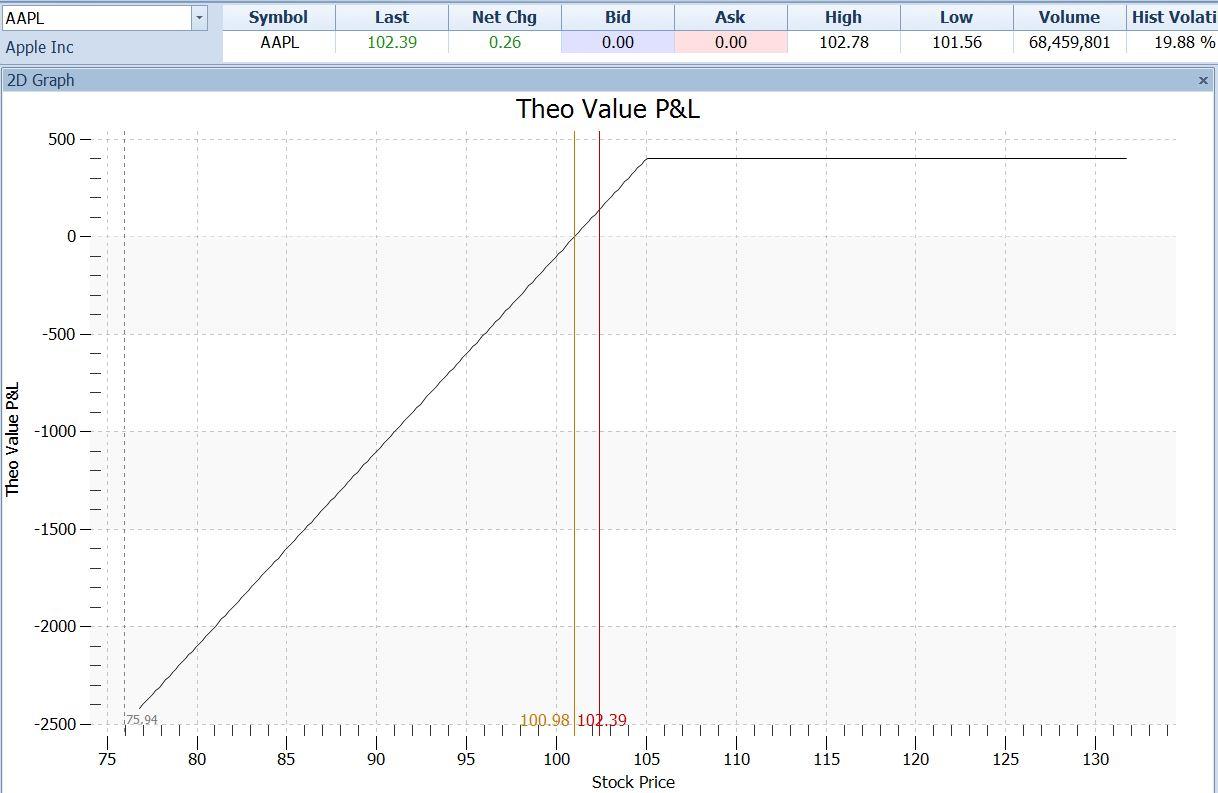
Now the trader has a combined position made up of his short call and his long stock position. Each side of this trade makes and loses money separately. But we can combine the diagrams of the two positions to view the result in a single chart, as shown here:
Figure 3 – Option Payoff diagram – Long 100 shares AAPL at $102.39, Short AAPL Sep 105 Cal @ $1.41
Note that this combination diagram could be arrived at by adding the values of its two component diagrams together. At the present price of $102.39, for example, the stock alone would have zero profit or loss, and this in reflected in figure 1 above, where the P&L curve’s vertical value is zero at a price of $102.39.
The short call alone (figure 2) shows a profit of $141 at that price.
The combination of the profit and loss of the two positions at a price of $102.39 is therefore the profit on the stock (zero) plus the profit on the short call ($141), for a total of $141. And in figure 3, the P&L curve has a vertical value of $141 where the red line cuts it at the $102.39 stock price.
Looking at another major milestone price, the $105 strike price:
Profit on stock = value minus cost = $105 – $102.39 = $2.61 X 100 shares = $261. This is the value of the P&L curve in figure 1 for the $105 stock price.
Profit on call = $141 premium. This is the value on figure 2 for P&L at a stock price of 105.
Combined profit = profit on stock plus profit on call = $261 + $141 = $402. And this is the value of the P&L curve on the covered call graph (figure 3) at that price.
And so it is at any stock price. The Profit or loss on any combined position is the total of that on all of the separate positions. The P&L diagram helps us visualize the combined position without having to do the math in our heads. It is with combined positions that the power of the payoff diagram as a tool really becomes indispensable.
In our Professional Option Trader class, we discuss many combined positions which wring out the real potential of options as a profit-making tool. Knowing which one to use in which market position is the key to option profits. The P&L diagrams are a key tool in that process.
So far, we have drawn diagrams only for one moment in time, which is at expiration. Next time we’ll talk about how the diagrams can help us see what happens at different times.
Information on these pages contains forward-looking statements that involve risks and uncertainties. Markets and instruments profiled on this page are for informational purposes only and should not in any way come across as a recommendation to buy or sell in these assets. You should do your own thorough research before making any investment decisions. FXStreet does not in any way guarantee that this information is free from mistakes, errors, or material misstatements. It also does not guarantee that this information is of a timely nature. Investing in Open Markets involves a great deal of risk, including the loss of all or a portion of your investment, as well as emotional distress. All risks, losses and costs associated with investing, including total loss of principal, are your responsibility. The views and opinions expressed in this article are those of the authors and do not necessarily reflect the official policy or position of FXStreet nor its advertisers.