Diverging
|Online Trading Academy graduates know that their trading decisions should be based on price action and volume. Technical indicators are very popular in the trading community but need to be used only as an odds enhancers. It is important to remember that an odds enhancer is used to increase the probability of a trade working out, not to signal the entrance to a trade itself. You should still execute trades based on price analysis and supply and demand levels. Whenever I start to discuss technical indicators, everyone always asks me what my favorite one is. I never get bored from watching the disappointment on their faces when I answer, “Price!”
The truth is, all indicators are built on past price and relationships to that price with volume included on some. If you understand the mechanics of the indicator, then you know how it is likely to read Price movement and when the indicator will give signals by simply reading price on a chart. When you can do this, then you will be ahead of those who are relying on an indicator to render a buy or sell signal prior to acting. Indicators can be helpful when used properly. Since the buy or sell signals usually appear late, we must observe the behavior of the indicator and take our signals from changes in that behavior.
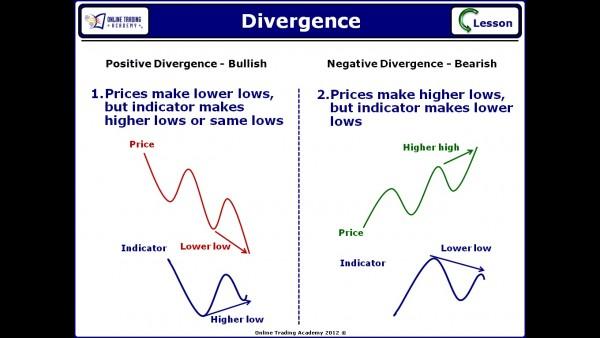
Enter divergence. Divergence is when the indicator is not exhibiting the same characteristics as the price of the security. When prices rise, you should be seeing higher highs and higher lows for the uptrend in price. You should also be seeing higher highs being made in the indicators. The opposite is true when in a downtrend, lower lows in price and the indicator. There are two types of divergence, positive and negative. Positive divergence typically signals the pause or end of a downtrend. In positive divergence, the price of the security makes lower lows and lower highs, a downtrend. However, the indicator makes the same lows or possibly higher lows.
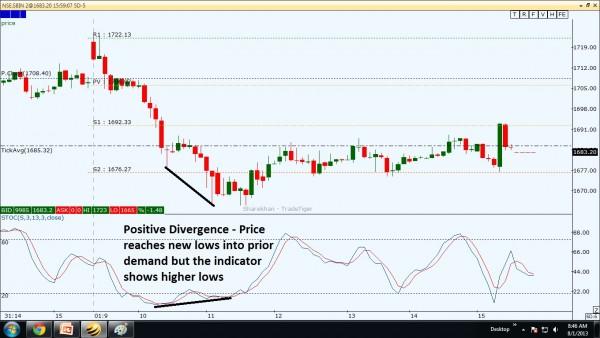
The divergence of the indicator shows that even though prices are continuing in the trend, they are doing so with less momentum and are unlikely to continue without a pause, correction or even a reversal. This is shown in the following chart with positive divergence in the Stochastics.
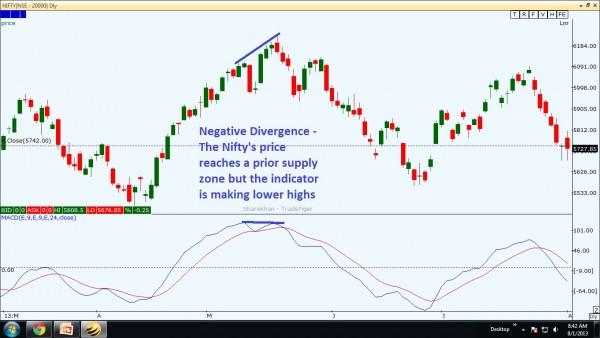
Negative divergence typically signals the end, pause or correction of an uptrend. It occurs when prices are making higher highs and higher lows (an uptrend), but the indicator makes similar or lower highs. This lack of momentum being demonstrated by price and reflected in the indicator is a signal of weakness of the trend. Be watchful for reversal signals in this environment.
A trader can use technical indicators, but you want to be sure to use them properly. Relying on them to signal your entry or exit to trades could lead to disaster. Looking for divergence to confirm your trade that was based on price action is the best way. Learn how to read price correctly by joining one of our courses today.
Information on these pages contains forward-looking statements that involve risks and uncertainties. Markets and instruments profiled on this page are for informational purposes only and should not in any way come across as a recommendation to buy or sell in these assets. You should do your own thorough research before making any investment decisions. FXStreet does not in any way guarantee that this information is free from mistakes, errors, or material misstatements. It also does not guarantee that this information is of a timely nature. Investing in Open Markets involves a great deal of risk, including the loss of all or a portion of your investment, as well as emotional distress. All risks, losses and costs associated with investing, including total loss of principal, are your responsibility. The views and opinions expressed in this article are those of the authors and do not necessarily reflect the official policy or position of FXStreet nor its advertisers.