Point and Figure – Part 2
|In my first article on Point and Figure (P&F) charting, I discussed the basics of creating that style of chart. In this article, I will build upon that knowledge and show more advanced methods for identifying patterns and projecting price movement. I want to mention that I tend to use this method of charting for longer term swing or position trades rather than intraday. Remember that time is not a factor while attempting to achieve targets in P&F and you will likely hold positions for some time.
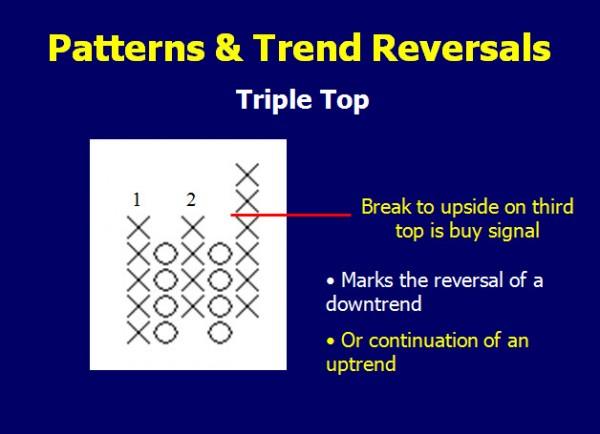
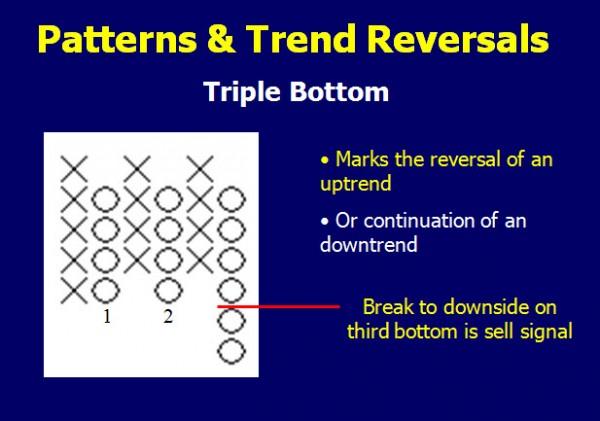
Patterns in P&F charts are a bit different than what you may be used to in candlestick charting. A triple top formation is not necessarily a reversal formation, it could be continuation. It will still offer a trading opportunity however. Look at the following examples of both the bullish and bearish triple formation.
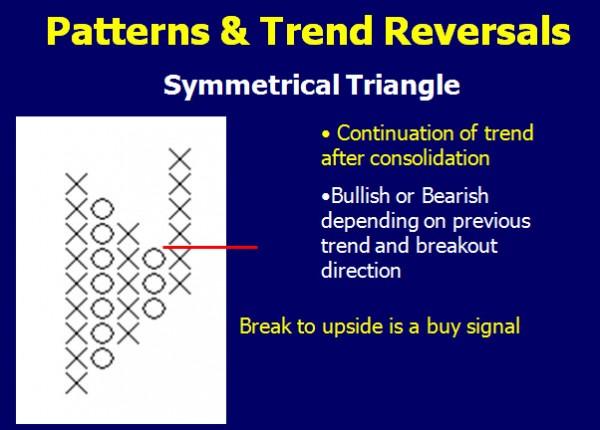
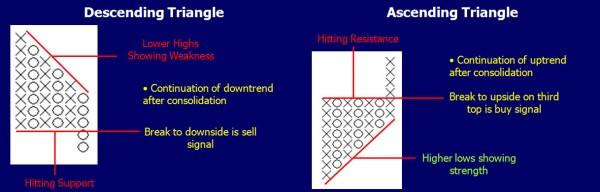
Even patterns such as triangles are visible and tradable on P&F charts. They will work in much the same manner as they would on candlestick charts.
In the previous article, ”Point and Figure,” I discussed the use of horizontal price projections.
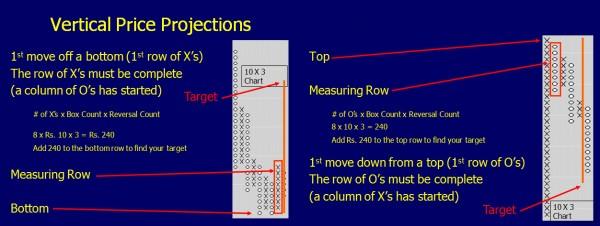
Many traders choose a different price projection method. If you are not using a 1 box reversal chart and have instead selected a three box, (this refers to how much price would have to reverse for you to start a new column Rs. 10×3 means price would have reversed a minimum of Rs. 30), you can try the vertical price projection method. I have found this style to be more accurate in projecting targets.
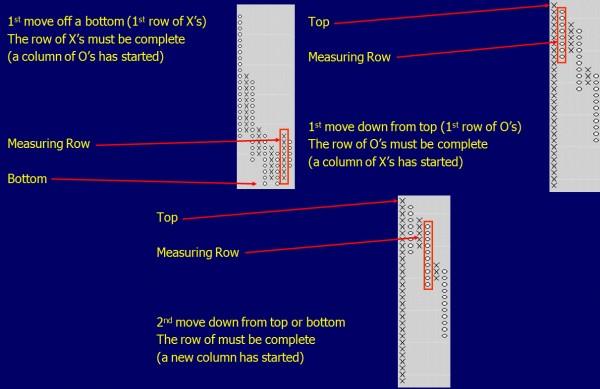
The vertical price projection can only be made under certain circumstances. They are:
-
1st move off a bottom (1st row of X’s)
-
1st move down from top (1st row of O’s)
-
2nd move from top or bottom
Once you have counted the correct column, you can multiply that count by the per box value and then multiply that number by the size for reversal. Your result should then be added to either the price bottom or subtracted from the price top to give you the price projection.
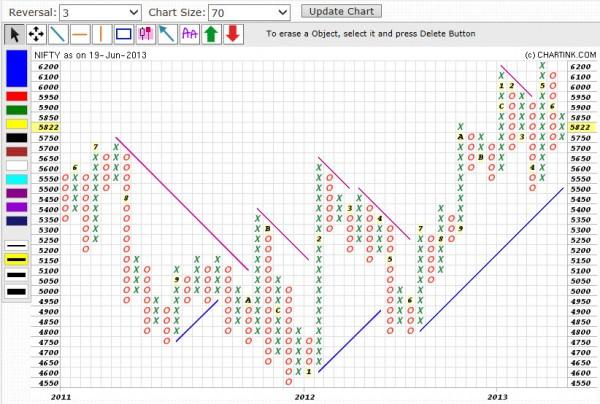
Now that we know the basics and what to look for, let’s examine a few P&F charts to see this technique in action. I have a chart of the Nifty in a 70×3 point and figure format. The 70 means I need a minimum of a 70 point move between closing prices to make a new box of X’s or O’s. I must also have a minimum of 210 points (70×3), to start a new column for a reversal. The numbers and letters refer to the months (1-9 are Jan. to Sept., A-C are Oct. to Dec.)
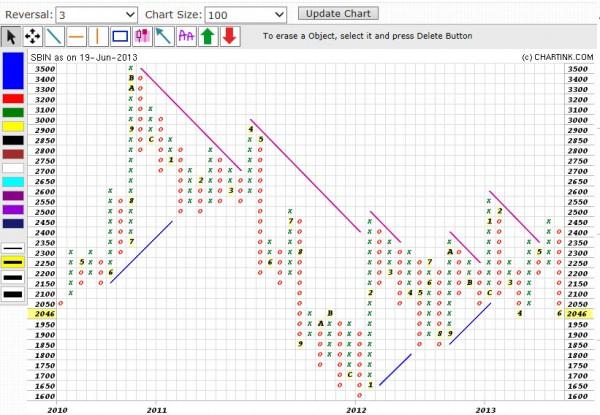
I can do the same with charts of individual stocks. I can adjust the box size on the chart for stocks or the indexes due to their higher or lower prices.
If you are looking for smaller duration trades, you can lessen the box size and also the closing periods. I had been using the daily closes on the previous charts. Depending on the trading software that you use, you can set box size smaller. This makes the chart more sensitive and allows me to see intraday activity. I can set the chart’s period to five minutes. If the close from a five minute period would cause a change in the chart, it is noted instead of waiting for the daily close.
By adjusting the box size and even what closing price the box will use, you can create all types of interesting charts to follow trends in the intraday or even multi decade trend following charts. The possibilities are limitless. Next week we will examine more strategies on point and figure charts and how to use them in conjunction with our core strategy of supply and demand.
Information on these pages contains forward-looking statements that involve risks and uncertainties. Markets and instruments profiled on this page are for informational purposes only and should not in any way come across as a recommendation to buy or sell in these assets. You should do your own thorough research before making any investment decisions. FXStreet does not in any way guarantee that this information is free from mistakes, errors, or material misstatements. It also does not guarantee that this information is of a timely nature. Investing in Open Markets involves a great deal of risk, including the loss of all or a portion of your investment, as well as emotional distress. All risks, losses and costs associated with investing, including total loss of principal, are your responsibility. The views and opinions expressed in this article are those of the authors and do not necessarily reflect the official policy or position of FXStreet nor its advertisers.