The Traps of Support and Resistance – Part 2
|
I had written an article two weeks ago entitled, “The Traps of Support and Resistance,” and as promised here is part two. If you have yet to read that article you can get it right now by clicking here. In that piece we discussed the concept of what support and resistance is in relation to technical analysis and charting the currency markets. I managed to cover the four main rules, which are most commonly adopted across the universal community of trading strategies and education. These were as follows:
Buy at or near Support
Sell at or near Resistance
Old Support becomes new Resistance
Old Resistance becomes new Support
In the last article, the focus was mainly upon the dangers of implementing too many support and resistance lines on a price chart which can often lead to confusion when trying to pinpoint exactly where the best opportunity to buy or sell is on the chart. Taking this into account, the focus was placed upon the Online Trading Academy patented core strategy that recognizes objective levels of institutional demand and supply in any market and allows us to buy low or sell high using low risk and high potential reward setups. Hopefully by now you have a pretty good understanding of what a quality demand or supply looks like from what I explained in the previous content.
It is now time to move on to the third and fourth rules, as we didn’t have time to cover them last time. The concept itself is a simple one, in that technical analysis studies suggest that when areas of resistance are traded through, there follows a dynamic shift in sentiment that in turn offers us a new trading opportunity. This concept is especially applicable when trading markets that are consistently making new higher highs and new higher lows, or in the case of a downtrend, new lower lows and new lower highs. In fact it has been traditionally accepted that treating old support as new resistance or old resistance as new support, is fundamentally one of the most effective ways to engage a trend. Let’s take a look at an example below to demonstrate this principle:
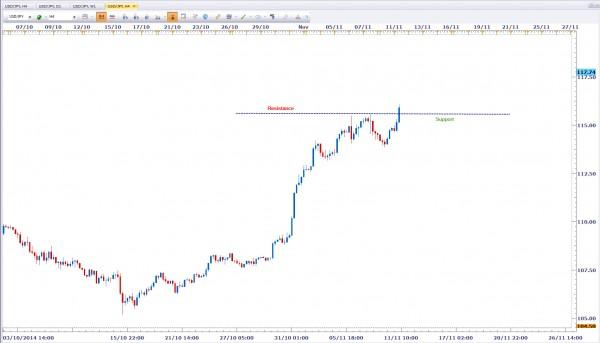
In the above chart of USDJPY we can observe the continuous upwards trend and notice how the majority of the time it has been making higher highs and higher lows. Using the concept of previous resistance becoming new support, a strategy which could be considered would involve waiting for a major resistance area to be broken and then extending that line forward making the assumption that it will be tested at a later stage as a new level of support. You’ll notice that while the concept and strategy itself makes sense, the price never makes it back to test the old resistance level as support, thus leaving us missing out on the continuation of the trend. In fact if we study the above price action carefully, we notice that there have been practically no instances where any previous resistance has ever become new support. Obviously this does not mean that this event never occurs but it does also highlight that there are many times when the price will go without us, no matter how rule-based and disciplined we are. So let’s move on later in time with the same currency pair and see if there are any further opportunities where resistance has been broken and so offered us an opportunity to buy a new support. Take a look at the below example and you can see an opportunity forming:
The above chart shows us a double retest of resistance at and around the price of 115.00. Therefore taking into account that now the resistance area has been broken with a large momentum candle, we would then consider using this same line as a support area to buy if the market pulls back to it. The same price that the original resistance area was at would become the new entry price in the assumption that it must now become support. Let’s see how this would’ve worked out as a trade:
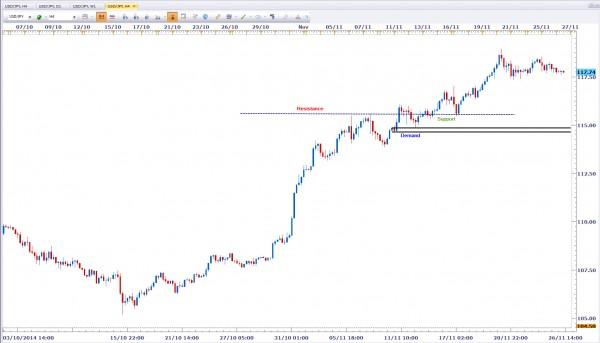
As we can see after prices did break through the resistance level, they did indeed fall back to the same area yet failed to respect the price as new support. At this stage we should ask ourselves the question of could things have been done any better? It’s incredibly difficult to place an adequate stop loss order below a single support or above a single resistance line, because the stop loss price itself is not really based on anything. There is nothing more frustrating then when you do get stopped out on a trade, only to see it then work and go in the direction you originally predicted that it would go in. This is actually what happened in the example we’re speaking about, as you’ll see from the chart example below:
According to Online Trading Academy’s educational curriculum, the situation above would be described as a trap. Do you notice how prices fell right back through the resistance level and never once regarded it as support? However, the market did go on to rally significantly from the 115.00 price area after triggering an objective level of demand, which I’ve marked out on the chart. This price action suggests to me that the institutions were relying on people using the old resistance area as a potential entry for support and so trapped most retail traders into thinking this is a good opportunity to buy, when really they themselves had their orders to buy much lower. It could even be assumed that when those people who bought at the higher price were forced to sell as their protective stop loss orders were triggered, they were in fact selling to the institutional buyers at the level of demand a little lower. This is why we think of this as a trap.
Over the years I’ve always taken a healthy interest in educating myself to the highest levels and understanding any subject I’m interested in, in the most thorough way. I also learned the hard way that education in a subject is just the first step and that we need to practically apply it so as to gain all-important experience for ourselves. One of the best ways to get that extra education and experience is to mimic those individuals who have the most success in their field, in this case financial institutions being those individuals. This is why our core strategy models the most successful investors, funds and banks and takes their outlook on the market and applies it for ourselves. Always be aware of the potential traps and pitfalls in anything you do. Knowing the environment is one thing but knowing your opponent is an altogether different dynamic in itself.
Information on these pages contains forward-looking statements that involve risks and uncertainties. Markets and instruments profiled on this page are for informational purposes only and should not in any way come across as a recommendation to buy or sell in these assets. You should do your own thorough research before making any investment decisions. FXStreet does not in any way guarantee that this information is free from mistakes, errors, or material misstatements. It also does not guarantee that this information is of a timely nature. Investing in Open Markets involves a great deal of risk, including the loss of all or a portion of your investment, as well as emotional distress. All risks, losses and costs associated with investing, including total loss of principal, are your responsibility. The views and opinions expressed in this article are those of the authors and do not necessarily reflect the official policy or position of FXStreet nor its advertisers.