Forex Trading with Bollinger Bands®
|Hello traders! I’m writing this week’s newsletter from beautiful Norwalk, Connecticut, while watching the sunset on Wednesday of a futures class. In this class there is a student who loves to use Bollinger Bands® as his own odds enhancer when trading, so I thought I would share a few helpful tips for this tool, applied to the spot forex market.
First let’s define what Bollinger Bands are. Investopedia defines Bollinger Bands as, “A band plotted two standard deviations away from a simple moving average, developed by famous technical trader John Bollinger.” If you’ve ever seen a bell curve showing a distribution of measurements of something, for example, people’s heights, incomes, home sizes, whatever, most of the data will be stacked in the middle of the bell curve. The further you go from the median/midpoint of the bell curve either above or below, the fewer data points you will get. If the average height of men in America is 5’9”, most men you meet here will be about that height. How many 7’2” men do you meet? One a month? One a year? The point is the further away from the median data point, the less likely it is to find these measurements. In trading, if prices go above or below the Bollinger Bands, those readings of price action are unusual, and prices should revert back to “normal” or inside the bands, if not all the way to the median. In statistics, the two standard deviations above and below the median (in this case, a moving average) should hold about 96% of all the data. Let’s take a look at a chart, which should be easier to understand!
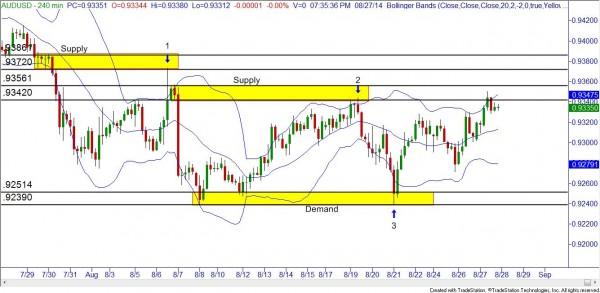
This is a four hour chart of the AUDUSD, with a Bollinger Band overlaid on the price action. The middle blue wiggly line is a 20 period moving average, and the other two wiggly lines are showing two standard deviations above and below the moving average. So, most (~96%) of the price action should be inside of the bands. Whenever price is outside of the bands, especially on fast moves outside of the bands, price action tends to quickly revert back inside the bands, usually to the moving average. If price action moves above the upper wiggly line, prices are considered overbought, and if price action moves below the lower wiggly line, prices are considered oversold.
In addition to the Bollinger Bands on the chart, I have also marked in two of our supply zones and one demand zone. Using the bands as an odds enhancer for your trading can definitely help, otherwise I wouldn’t have written this article! At the blue arrow labeled “1,” you can see that price action rapidly moved up to supply, well past the upper band. So…would you take that short trade? Price moved quickly to a clean supply zone, deep into “overbought” territory on our Bollinger Band tool. I hope you would be interested in this trade! As mentioned previously, a potential first target would be the moving average; however, I prefer to use previous demand for a target on short trades, and previous supply for targets on long trades.
At the second blue arrow, marked “2,” price again moved up into supply, but this time just barely peaked out above the Bollinger Band. While I would prefer a faster, farther move out of the band to take a trade, this example still did fit our criteria.
At the third arrow, marked “3,” price quickly fell into a demand zone and again, well outside the Bollinger Band. This would have fit the criteria of trading with our patented core strategy, plus with the added bonus of being “oversold” with the bands.
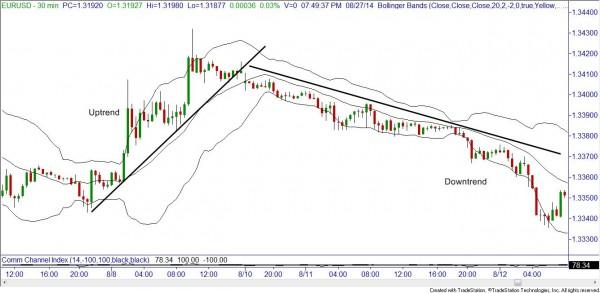
Another helpful use for the Bollinger Band tool is to help you stay with a trending market. In an uptrend, very often the trend will be held between the moving average and the upper band. In a downtrend, usually the move is held between the moving average and the lower band. Both examples are demonstrated in the following chart.
So there you have a breakdown on a couple of easy ways to use the Bollinger Bands to help you trade: first, to help with entering trades, and second, to help you stay with a trending market. Please don’t try to only use Bollinger Bands to make your trading decisions! There have been thousands of traders out there who have tried to use just one indicator or oscillator to make their trading decisions for them; why do you think you don’t hear about those traders? Because using just one thing that comes FREE with your trading platform won’t consistently make you money! Combined with our supply and demand strategy can make these bands a very powerful tool. Yes, there are a few more tricks to these bands, but we’ll have to save those for our live classrooms or our Extended Learning Track online training rooms.
Information on these pages contains forward-looking statements that involve risks and uncertainties. Markets and instruments profiled on this page are for informational purposes only and should not in any way come across as a recommendation to buy or sell in these assets. You should do your own thorough research before making any investment decisions. FXStreet does not in any way guarantee that this information is free from mistakes, errors, or material misstatements. It also does not guarantee that this information is of a timely nature. Investing in Open Markets involves a great deal of risk, including the loss of all or a portion of your investment, as well as emotional distress. All risks, losses and costs associated with investing, including total loss of principal, are your responsibility. The views and opinions expressed in this article are those of the authors and do not necessarily reflect the official policy or position of FXStreet nor its advertisers.