Enhancing A Commodity Turning Point
|Recently I wrote an article on Setting up a Commodity Trade. One of the tools I mentioned was Relative Strength in conjunction with our usual trend and core technical analysis of Supply/Demand. Commodity Futures allow us to take a peek at what the smart money in the market is doing if we know how to read the charts. In this article I would like to discuss how looking at multiple months of the same Commodity can often reveal what the smart money is doing in the market.
In class I point out that the smart money traders are the Commercials. These traders are specialists in the particular market they participate in. A Commercial uses the actual physical Commodity daily in their course of running their business. This means they must know everything there possibly is to know about the fundamental supply/demand factors, seasonal patterns, current situations that may disrupt their distribution/accumulation of the Commodity they produce or process and a host of other things that only a true professional with large resources could possibly gain from market information.
Remember that when it comes to trading Commodity Futures the speculators in the market are only there to move price to the upper price levels for the Producers of a Commodity to lock in hedges. And then to push prices down to the Processors of a Commodity to lock in lower prices for future delivery. Our job as speculators is to try and gain an edge in our trading style that allows us to participate in the same direction as the smart money, Commercial traders do.
Using Relative Strength of various months of a particular Commodity contract is one way to get this edge. There is a technical indicator called Relative Strength Index (RSI), but this article has nothing to do with an indicator. We will be looking at pure price action in real time as it unfolds.
All Commodity Futures contracts have multiple contract months trading simultaneously at any given time of the day. I will be looking at the Live Cattle contract traded on the CME Group Exchange in this article. The Live Cattle contract months traded are February, April, June, August, October and December. Currently April is the front month contract (most actively traded contract of them all) and this is where the majority of speculators will be trading. The other months of Live Cattle are available to the Commercial traders to use for Hedging price risk for futures production and processing of Live Cattle. Speculators are allowed to trade these back months, but rarely do because they do not have much liquidity.
I will be discussing a Seasonal pattern that I found from Moore Research Company (MRCI) on Live Cattle. As a reminder: This is NOT a trade recommendation, it is to be used for educational purposes only.
MRCI has researched the Live Cattle market and found that the April Live Cattle contract has closed lower on March 19 than on February 7 80% of the time in the last 15 years. The average profit has been approximately $618. Another reminder, traders are encouraged NOT to take these Seasonal research patterns blindly. While they may work with high percentage results the drawdowns (losses before closing the position at the optimal exit date) can sometimes be very large. Our job as traders is to apply our own analysis to this research and filter out the markets that meet our criteria to place a trade.
This would mean we need to find supply/demand technical levels for price to retrace back to for entry, trend analysis and or other trade enhancers that we may use to qualify a high probability – low risk trade setup.
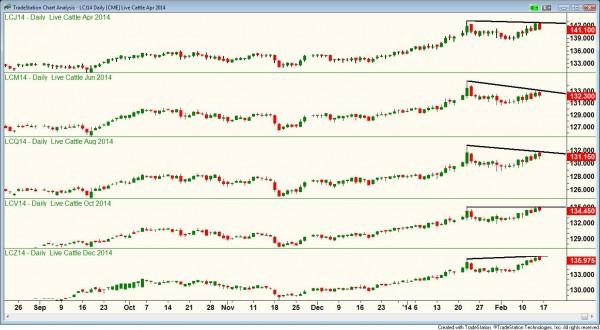
Figure 1 will show the next several contracts of Live Cattle being traded as of this writing.
Live Cattle Futures contracts have been making new contract highs recently. Meaning that since the first trading day of the contract a couple of years ago, prices have never traded this high for each of these contracts. Contract highs are a very bullish signal for markets. However, after a market makes several new contract highs there comes a point where there is no more value in a market to new participants and they will quit buying as will trend followers already in the market. At this point demand will become weak and supply from profit taking and Commercial ranchers will take over and cause price to fall.
What we see in the charts above is that around the third week of January, 2014 Live Cattle Futures made their last contract high for the move. Now as the Live Cattle contracts come back to test these highs we see something out of character for higher prices in this market. Can you spot it?
We can see the front month contract is priced higher than the next two contracts in the cycle. This is referred to as an inverted market and again a strong bullish signal. The question is how long has this market been inverted? Looking back I found the market has been inverted for a minimum of 2 years. This bull market may be getting a little long in the tooth.
The interesting thing about the current price structure according to Relative Strength is that the front months of Live Cattle are struggling to get back to the previous contract highs. The back months of October and December are either at the previous contract high or making new contract highs as illustrated by the trend lines I have drawn across the highs of these moves.
When the back months are performing stronger than the front months that usually means Commercial traders are going to be holding back on bringing their Live Cattle to market. If this was a storable Commodity market it would show the product is being stored and delivered at a future date sometime.
If the front months were making new contract highs that would be telling us there is so much fundamental demand for Live Cattle that the Commercial traders are bringing in their Live Cattle immediately to take advantage of the current higher prices.
Looking at these charts I do not see that pattern forming here. With a Seasonal sell in Live Cattle currently in affect and another one coming in early March it is hard to believe we have a lot of upside left in this market. Can we go higher? Of course!!!! A trader would still need to look at their risk/reward on making this type of trade and determine if it fits their trading plan.
If a trader were to look at an un-adjusted continuous daily chart of Live Cattle (@LC=117XN+GJMQVZ) they could find we have some supply over head up to approximately the 145 handle.
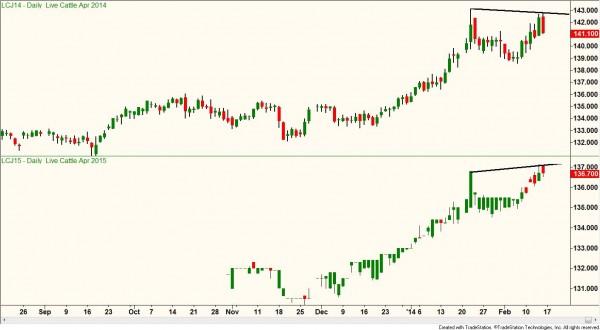
Figure 2 is a chart of Live Cattle, but in this example I created a Relative Strength of April 2014 and April 2015. We again see a more pronounced back month price action stronger than the front month.
My experience has shown me this does not work as well with the Financial Futures contracts due to their lack of liquidity in back months. This creates very short durations of contracts with high volume.
Relative Strength can show how the smart money is posturing themselves in the back months of a Commodity compared to the front months.
“I’ve got a theory that if you give 100% all of the time somehow things will work out in the end.” Larry Bird
Don Dawson
Information on these pages contains forward-looking statements that involve risks and uncertainties. Markets and instruments profiled on this page are for informational purposes only and should not in any way come across as a recommendation to buy or sell in these assets. You should do your own thorough research before making any investment decisions. FXStreet does not in any way guarantee that this information is free from mistakes, errors, or material misstatements. It also does not guarantee that this information is of a timely nature. Investing in Open Markets involves a great deal of risk, including the loss of all or a portion of your investment, as well as emotional distress. All risks, losses and costs associated with investing, including total loss of principal, are your responsibility. The views and opinions expressed in this article are those of the authors and do not necessarily reflect the official policy or position of FXStreet nor its advertisers.