S&P Doomed to Repeat?
|George Santayana is popularly known for aphorisms such as, “Those who cannot remember the past are condemned to repeat it.” When it comes to the markets, this is often the rule more than the exception. In fact, Online Trading Academy’s core strategy is based on locating repeatable patterns that demonstrate where the institutional traders are placing their orders.
When you look at charts, you are looking at the historical picture of price action. This price action is caused by the thoughts and perceptions of the market participants. During various economic and political conditions these thoughts and perceptions influence traders and investors in predictable manners. By viewing similar patterns, we can often predict future behavior of the financial markets.
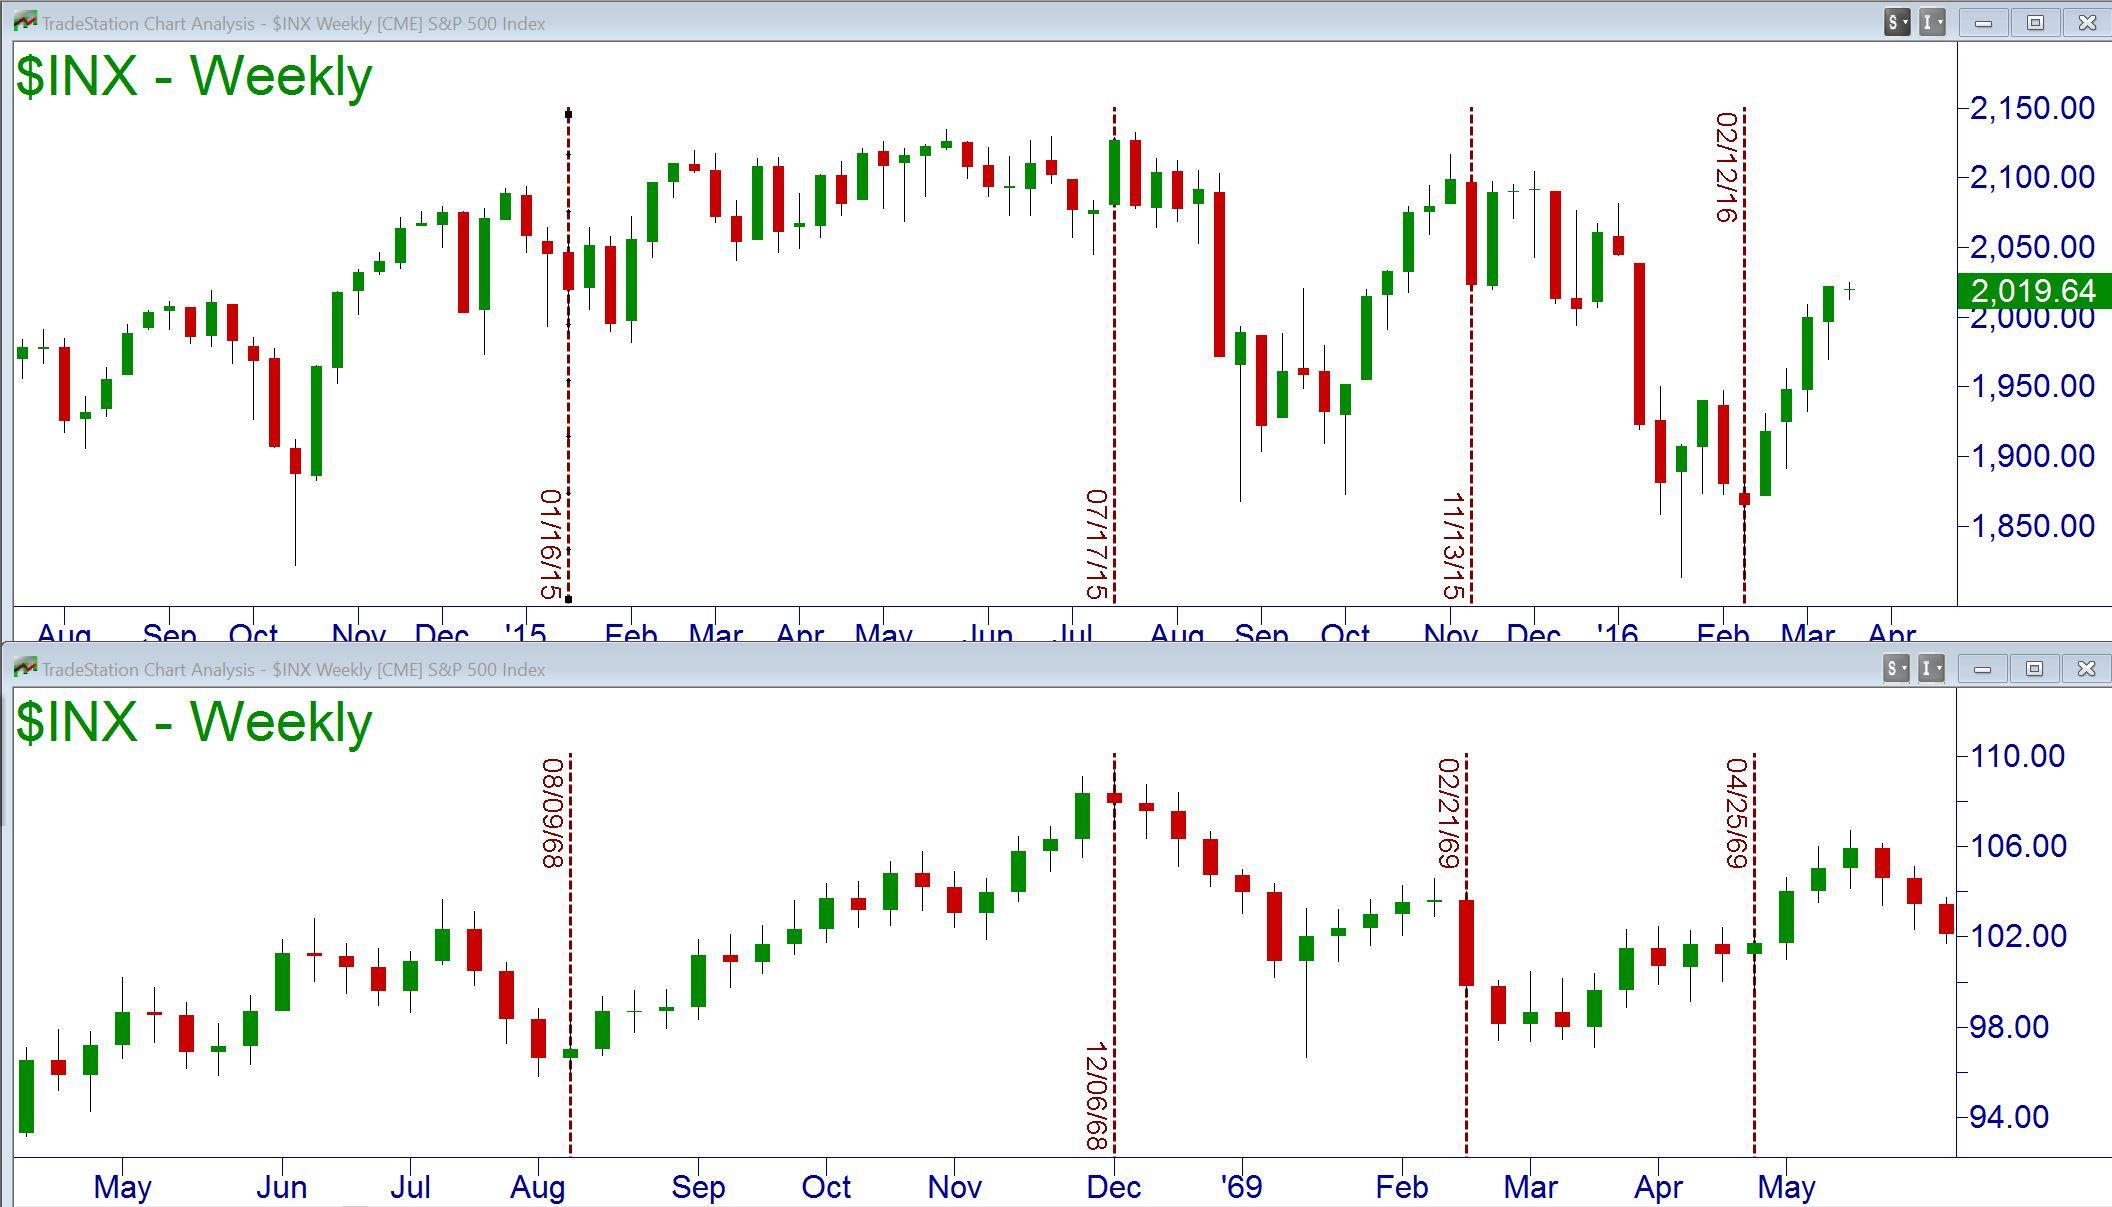
Purely by accident, I was viewing charts of the S&P 500 from the past with one of my classes when I noticed a period of time where the markets looked eerily similar to the price patterns we are currently experiencing. Looking at the following chart, you can see the top chart is a weekly picture of the S&P 500 index. The bottom chart is also a weekly chart of the S&P 500, but from 1968 to 1969.
While not exact, the price patterns are extremely similar. The dips and rallies occurred in nearly the same pattern in 2015 and 2016 as they did in the late 1960’s.
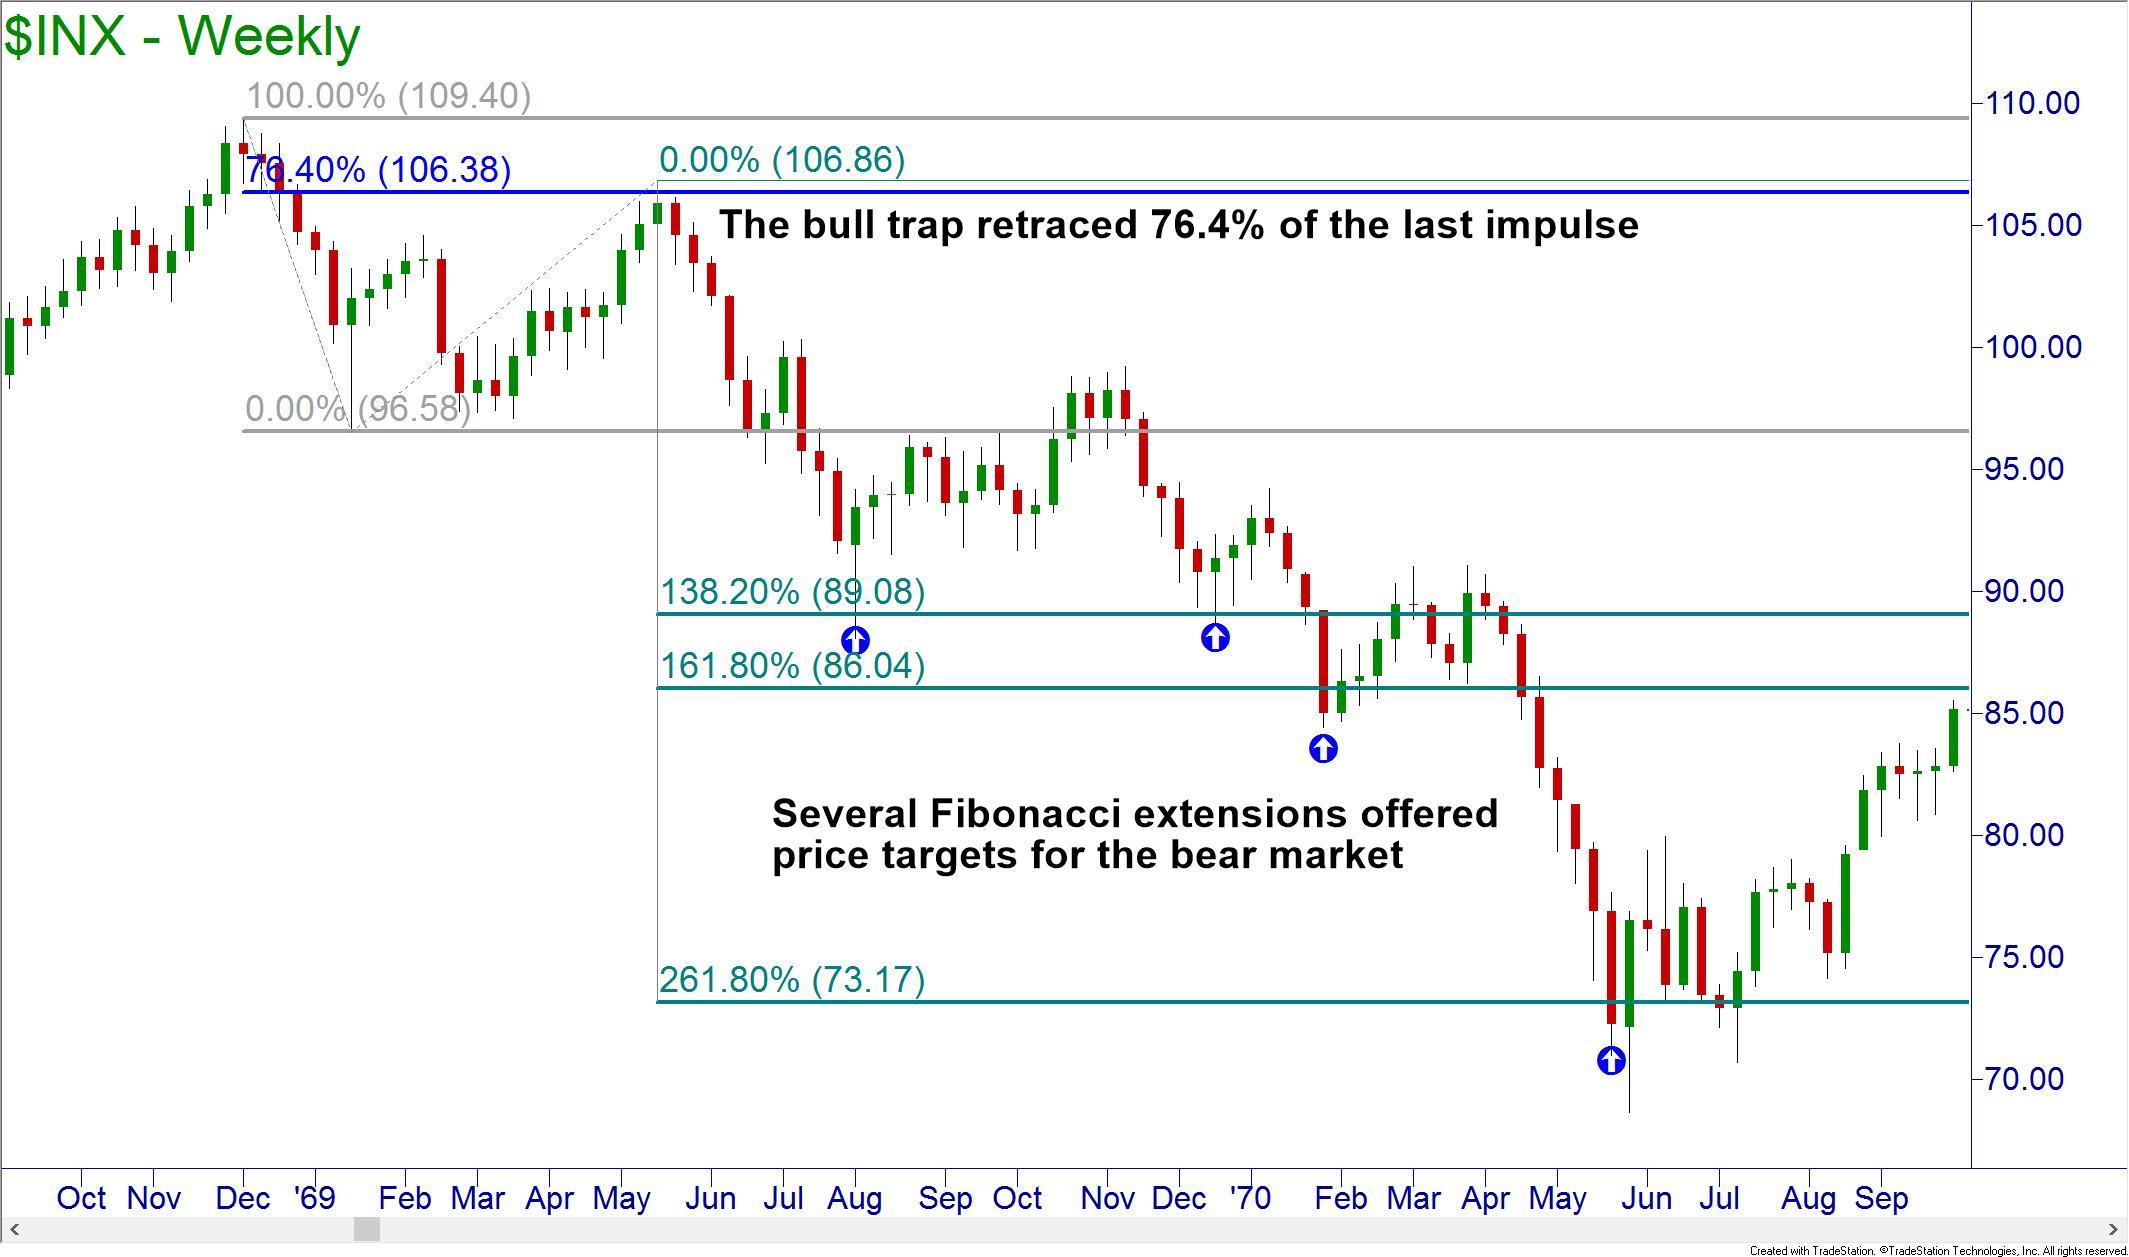
Applying some advanced technical analysis techniques, such as Fibonaccis, to the price action of the 1960s, you can see that there was a bull trap just before the bear market that extended from 1969 through 1970. A bull trap is when prices rise after a sharp decline from a major price peak. This rapid rise leads investors to believe that the drop was only a small correction and that the bull market will shortly resume. This is a pattern that has repeated itself for every bubble burst and bear market.
There was a sharp rise in early 1969 that retraced 76.4% of the drop from the peak in prices. Once the decline began, the Fibonacci Extensions offered potential targets for shorting opportunities, including the bottom of the bear market.
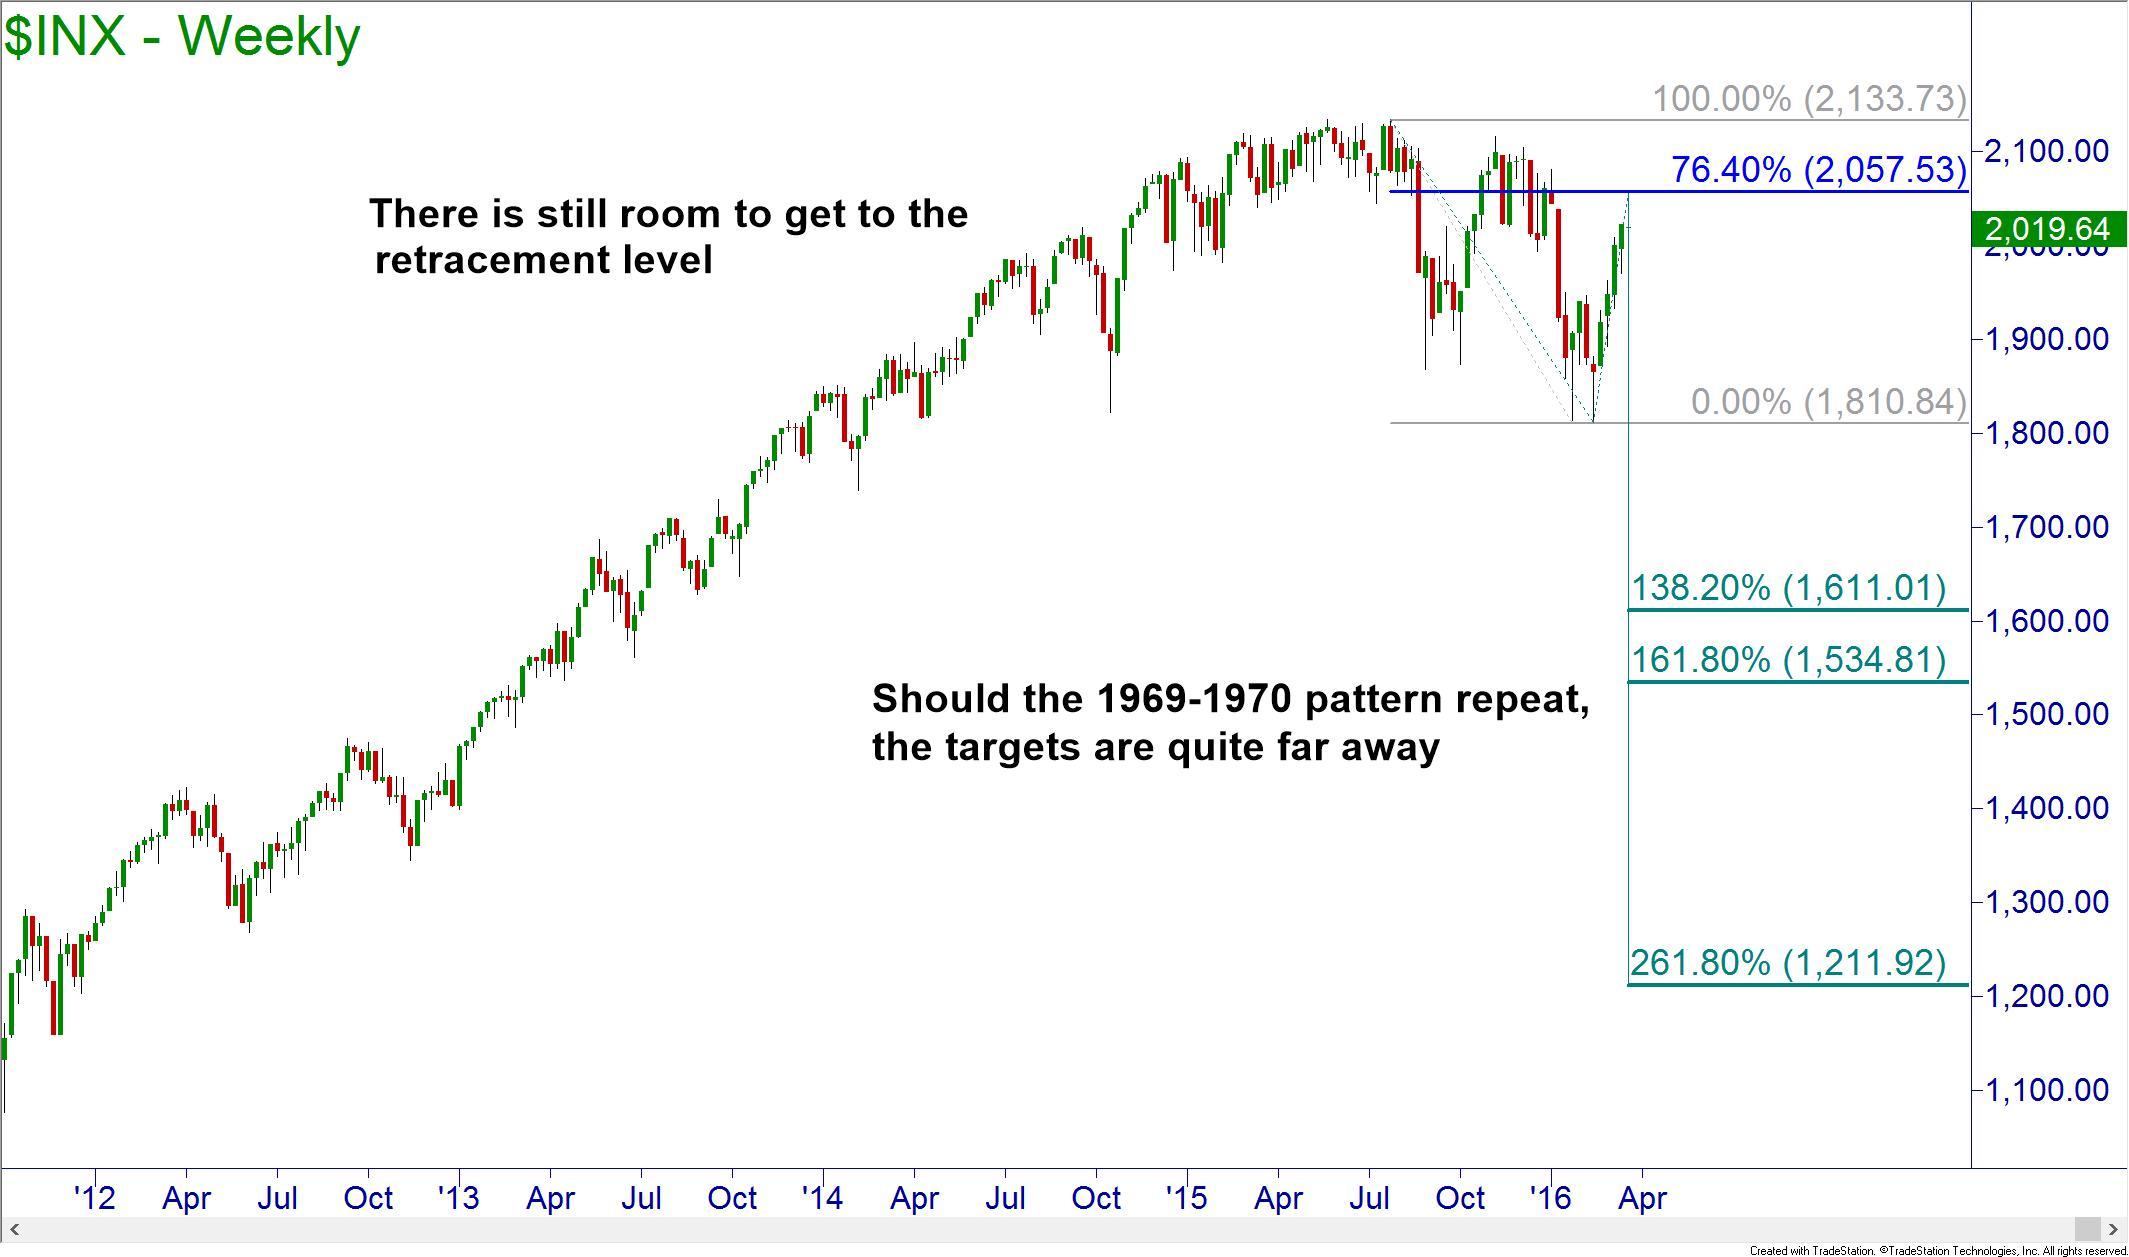
Applying the same Fibonacci techniques to the current S&P 500 price chart, the bull trap appears to be in place and ready to spring on unsuspecting traders and investors. Should we follow the same pattern as the 1960s, the index will continue to climb until approximately 2057. Once there the bear market should begin with prices targeting a few points along the way.
The first major target for bearish price action would be in the low 1600s. Once there, price would likely see a small bounce. The bear market would definitely be in full swing as that would be a price drop from the highs of about 25%. Further price targets are 1530 and the potential bottom of the market at the low 1200s. There is a strong weekly demand at 1440 that could be the bottom instead of the Fibonacci projection.
That brings up an important point. Supply and demand zones are the primary driving force of price. The Fibonacci tools are just to be used as a supporting tool, not the decision maker itself. The retracement to 2057 also corresponds to a supply zone which makes the level stronger. Trust your levels when navigating the markets in order to increase your chances for success.
To learn how to identify the proper zones, visit your local Online Trading Academy Education Center and enroll in a course today!
Information on these pages contains forward-looking statements that involve risks and uncertainties. Markets and instruments profiled on this page are for informational purposes only and should not in any way come across as a recommendation to buy or sell in these assets. You should do your own thorough research before making any investment decisions. FXStreet does not in any way guarantee that this information is free from mistakes, errors, or material misstatements. It also does not guarantee that this information is of a timely nature. Investing in Open Markets involves a great deal of risk, including the loss of all or a portion of your investment, as well as emotional distress. All risks, losses and costs associated with investing, including total loss of principal, are your responsibility. The views and opinions expressed in this article are those of the authors and do not necessarily reflect the official policy or position of FXStreet nor its advertisers.