Riding the Waves
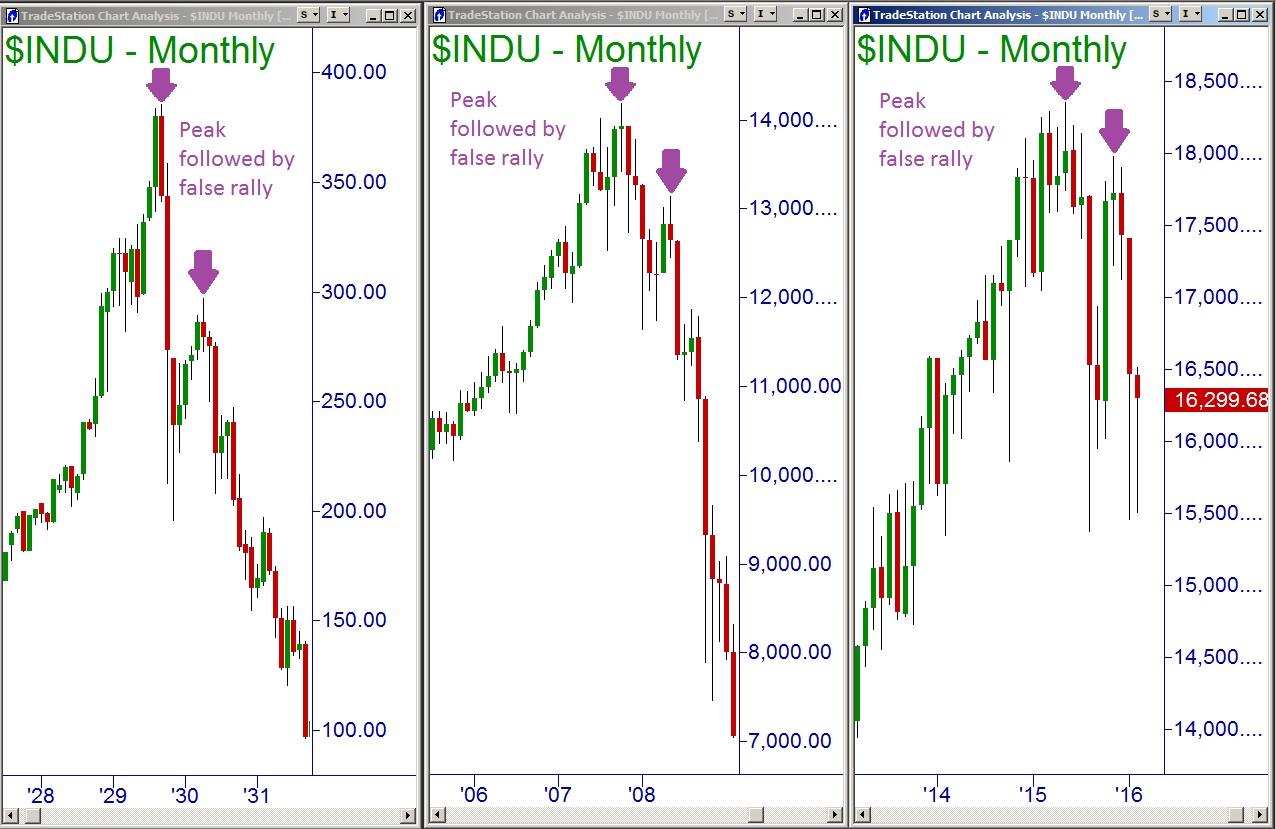
|Many people compare a lot of current price action in the markets with that of the great market crash and depression in the 1920’s. There may be some good reasons for that as price patterns do seem to repeat often. Another thing that can be useful from that era of trading is one of the technical analysis techniques, Elliott Wave.
I have received several emails requesting me to explain Elliott Wave Theory. While I do not use it for determining my entries and exits for trades, (I stick to Online Trading Academy’s Core Strategy), the theory can be useful for identifying trends and potential changes in those trends.
Ralph Nelson Elliot analyzed the Dow’s price action during the Great Depression and identified that the markets are fractal in nature and that they are comprised of rhythmic waves in price movement. He theorized that these waves could be predicted and measured. These price patterns work in all markets and in multiple timeframes.
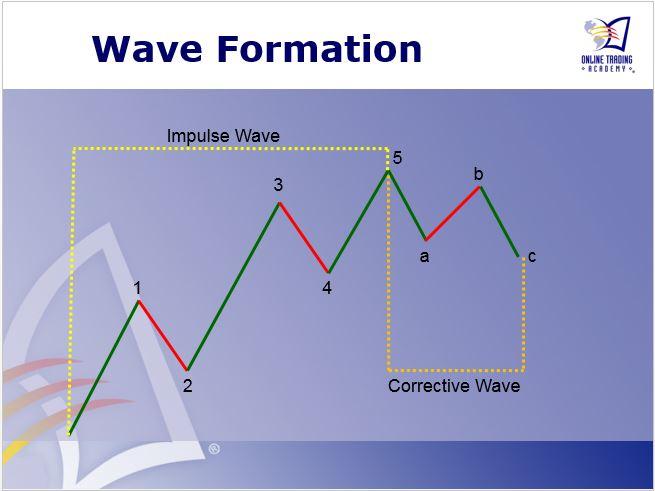
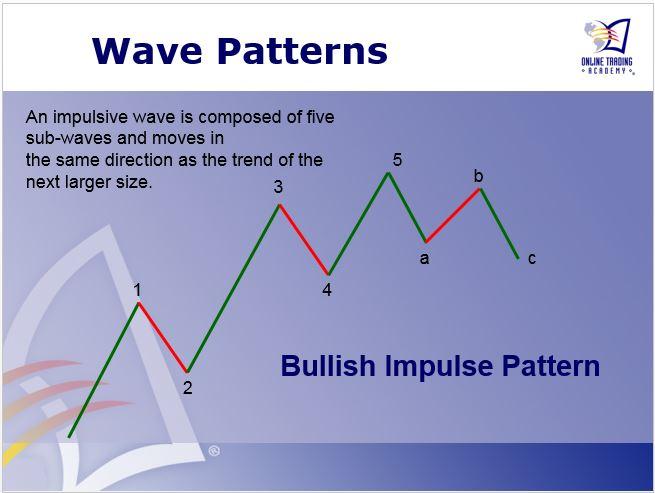
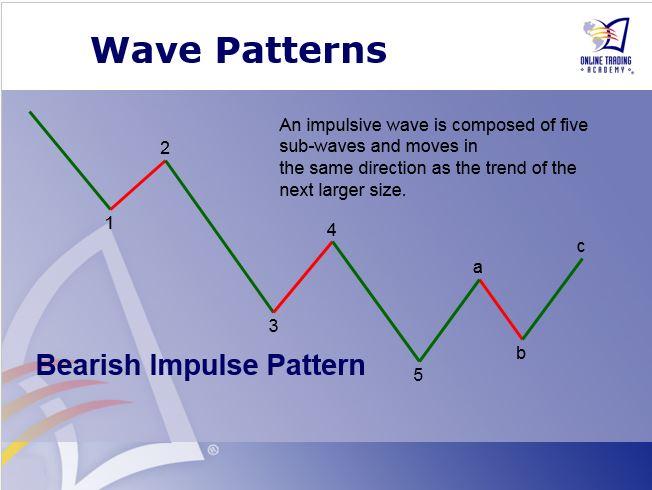
The main principle of the Elliott Wave Theory is that prices move in a five wave pattern within the direction of the larger timeframe trend. Once those five waves have been completed, then prices start a three wave correction in the opposite direction before beginning another five wave pattern.
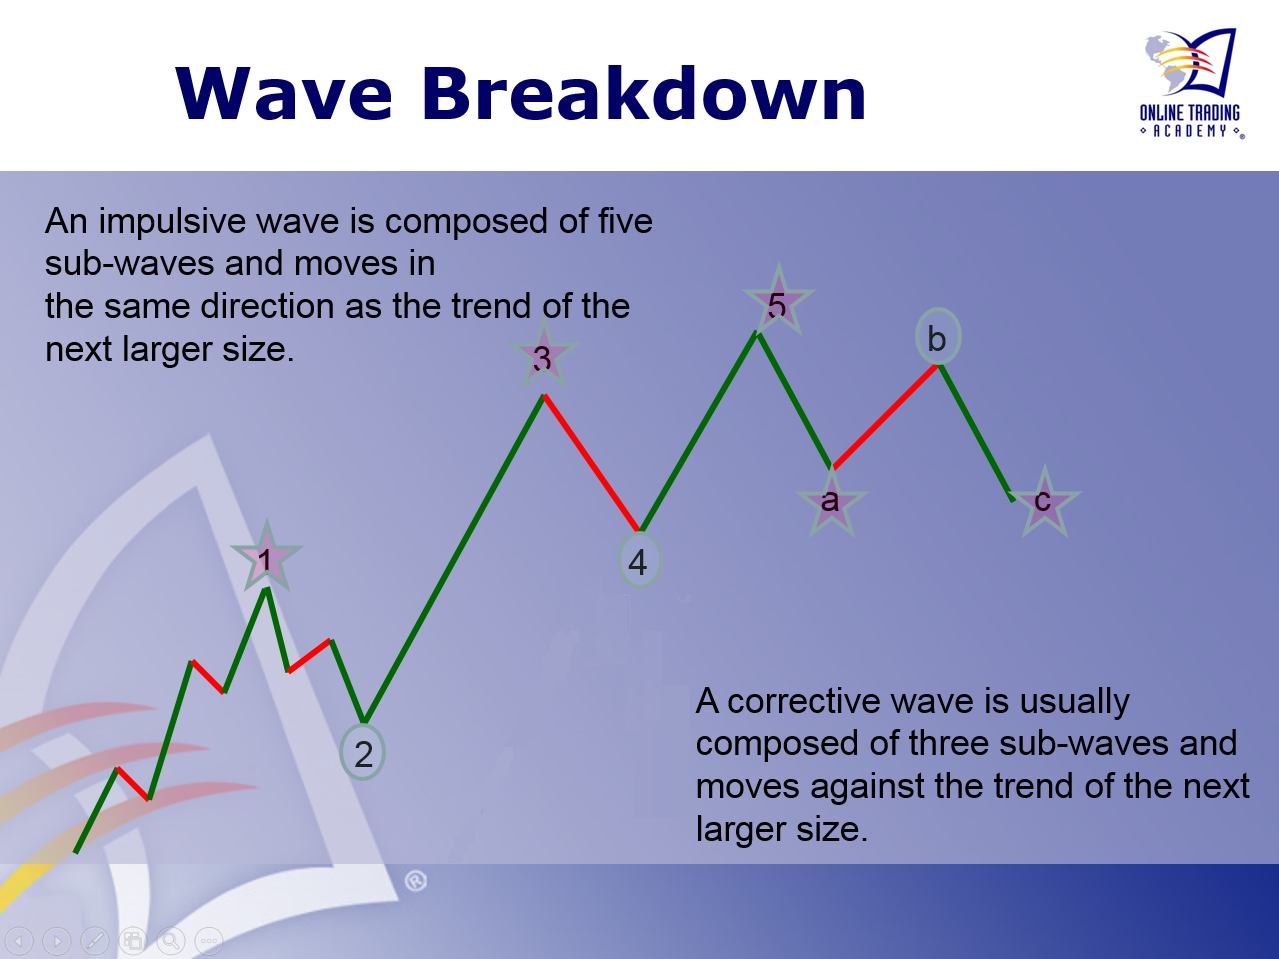
Just as the large impulse wave is broken into five components, the impulse waves, (labeled as “1,” “3,” and “5”), can be divided into five smaller waves themselves. The corrections, (labeled 2, 4 and b), subdivide into three small waves.
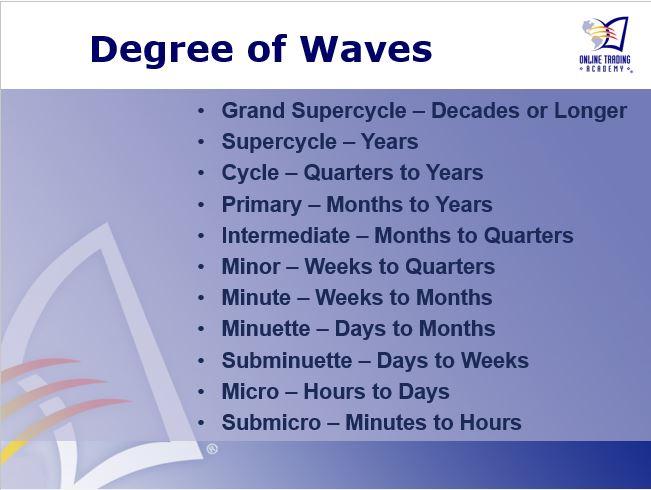
It is helpful to know what trend you are looking at when making your analysis. The traditional timeframes for the waves are below.
There are certain rules that apply to using Elliott Wave analysis on price charts. This will help with properly identifying the waves:
Wave 2 (a correction) cannot retrace 100% of Wave 1
Wave 3 cannot be the shortest wave, it is often the longest or can be at least the same length as Wave 1 or Wave 5
Wave 4 cannot enter the price action of Wave 1, however, there is one exception to this
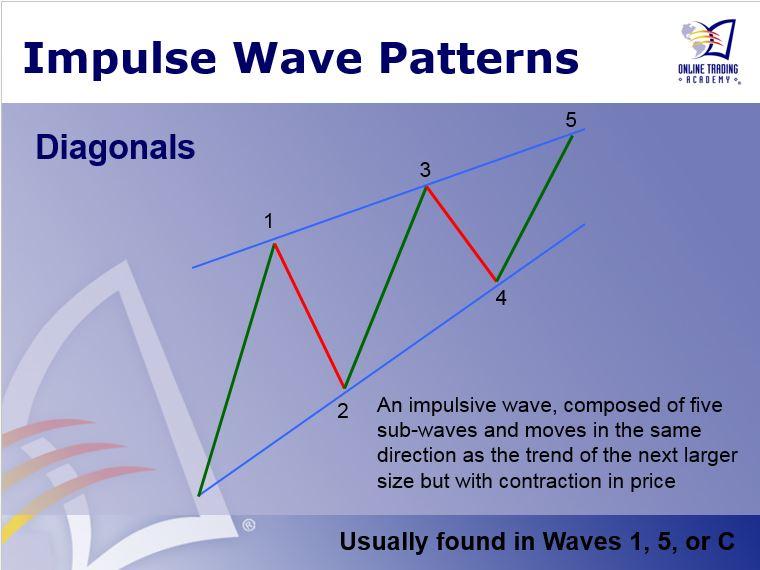
The exception for when Wave 4 can enter into the price action of Wave 1 is when the impulse wave is forming what is called a diagonal. The diagonal is when prices are narrowing in the impulsive direction. It is usually seen in waves 1, 5 or C.
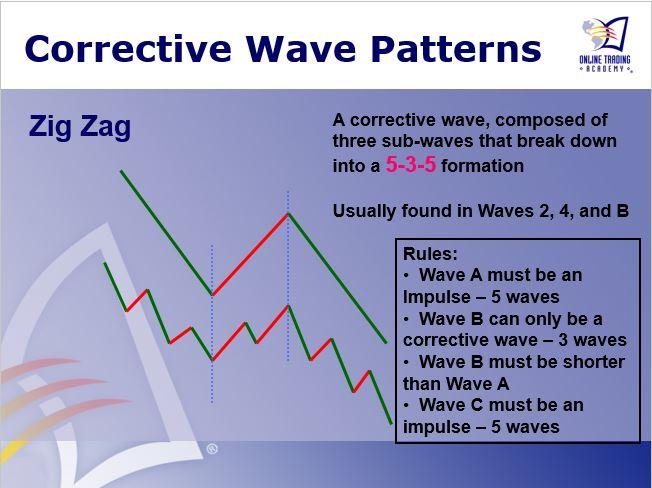
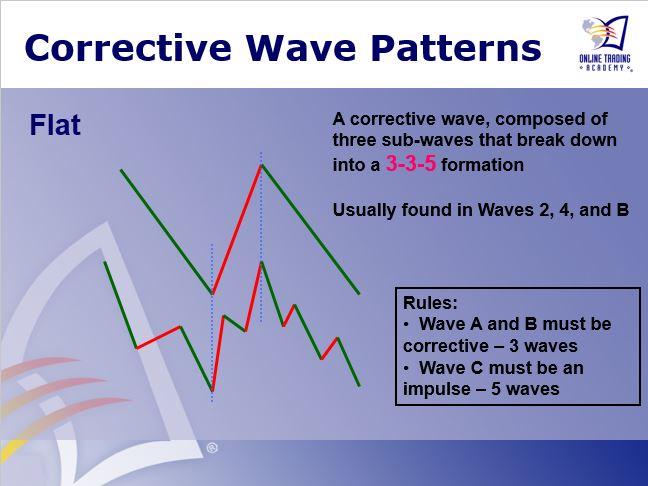
As mentioned earlier, the corrective waves also have distinctive patterns and can be divided into three sub-waves that all together move against the trend of the larger size. There are two patterns that the corrective waves usually fit into, the zig zag and the flat.
Although the zig zag is a corrective pattern, the smaller waves that move with the correction divide into five sub-wave impulses. Overall this creates a 5-3-5 waver formation in the A-B-C.
The flat pattern is a 3-3-5 sub-wave formation. The overall correction’s price action usually moves sideways instead of moving sharply against the larger trend as the zig zag does.
A useful bit of information when trying to predict the potential shape of the newest correction, note the shape of the preceding one. Due to alternation, Wave 4 will usually take on the opposite shape of Wave 2 in the same impulse. So if Wave 2 was a flat, expect a zig zag for Wave 4 and vice versa.
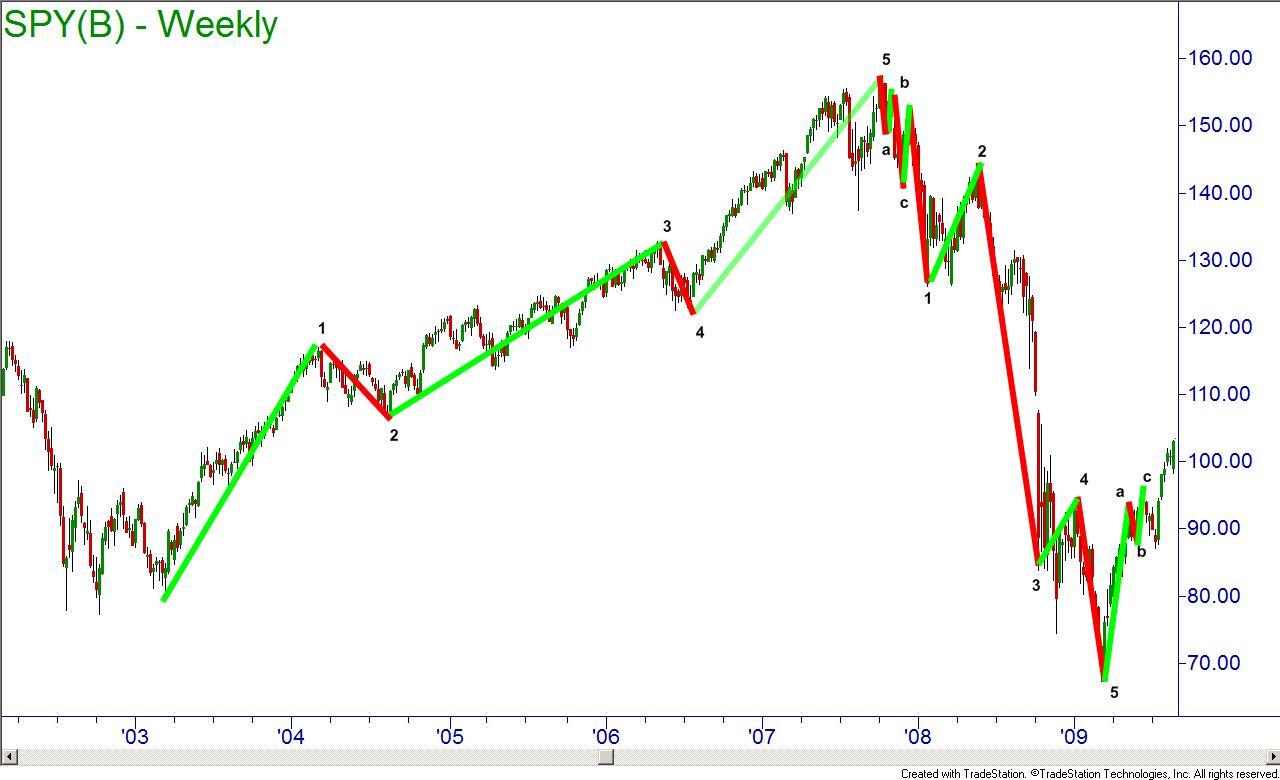
The Elliott Wave theory should only be applied to liquid and heavily traded stocks. It can also be applied successfully to the indexes. Looking at the chart below, you can see how the SPY rise and crash from 2003 to 2009 fit the pattern.
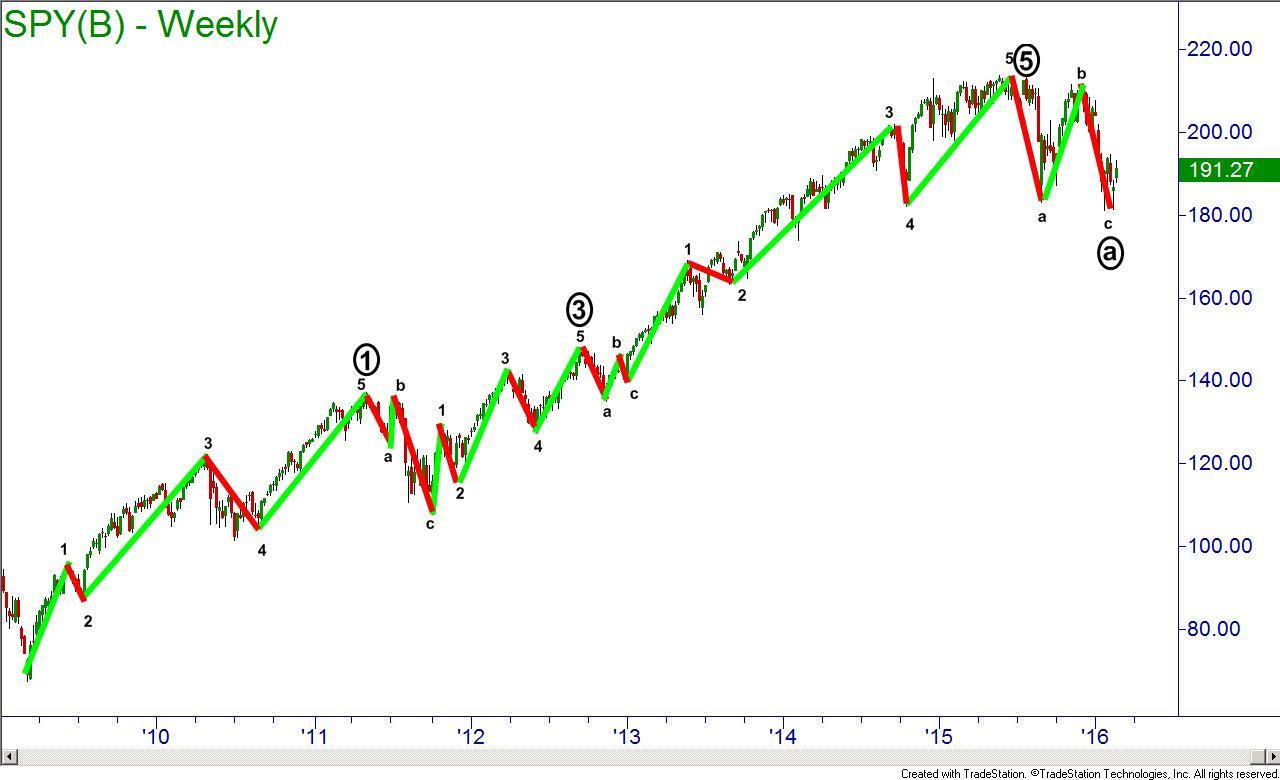
In the following chart, I applied the wave pattern to the current bullish market run that started in 2009.
It can start to get a little confusing, but if you practice and stick to the simple rules the theory starts to make sense of the seemingly random markets. Next week, I will dive deeper into the Elliott Wave Theory including how to measure and trade the waves. Until then, trade safe and trade well!
Information on these pages contains forward-looking statements that involve risks and uncertainties. Markets and instruments profiled on this page are for informational purposes only and should not in any way come across as a recommendation to buy or sell in these assets. You should do your own thorough research before making any investment decisions. FXStreet does not in any way guarantee that this information is free from mistakes, errors, or material misstatements. It also does not guarantee that this information is of a timely nature. Investing in Open Markets involves a great deal of risk, including the loss of all or a portion of your investment, as well as emotional distress. All risks, losses and costs associated with investing, including total loss of principal, are your responsibility. The views and opinions expressed in this article are those of the authors and do not necessarily reflect the official policy or position of FXStreet nor its advertisers.