Open Interest and Market Direction
|“There’s a sucker born every minute!” You are likely familiar with this phrase which has been attributed to the late P.T. Barnum. It means that there are a lot of gullible people in the world. Wall Street is counting on investor vulnerability in order to line their own pockets.
Business television helps to perpetuate this. Most of the time, when you tune in you are bombarded with “news” of the hottest stocks; the ones that have already increased in price. This entices the general public to buy stocks at inflated prices. Who do you think is selling them these stocks?
When making the decision to join a trend, it is helpful to know who is behind that trend. For instance, if price is being pushed higher by novice traders it may not be wise to join them. However, if the buying pressure is being created by institutional trading there is a higher probability for it to continue.
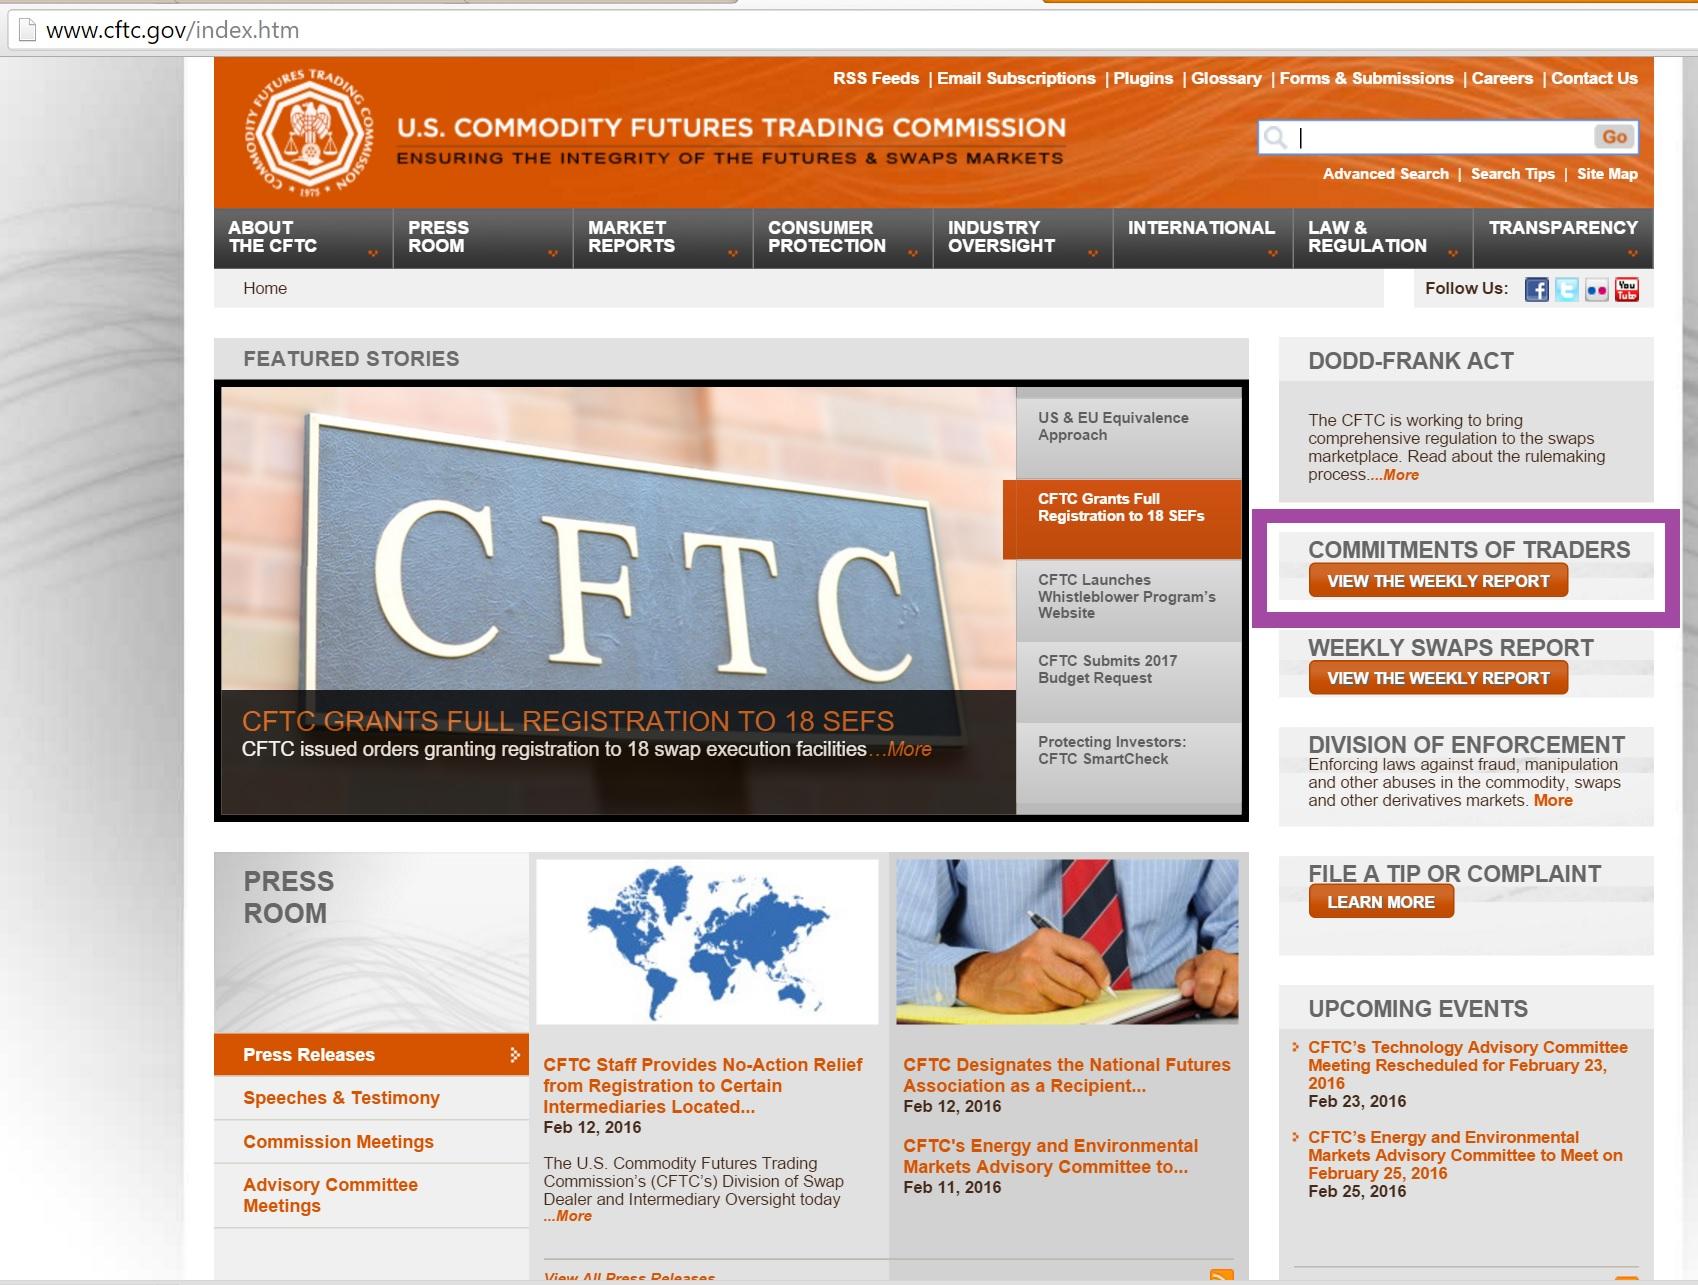
The Commitment of Traders report (commonly referred to as the COT) has been published by the Commodity Futures Trading Commission since 1962 and provides information on the open interest of futures contracts. The COT report is published every Friday and contains the data from the previous Tuesday. A futures contract is a derivative which gets its value from an underlying asset. They are traded to either profit from future values of the asset or to hedge a position in the asset against a drop in price. The COT shows open interest in a multitude of commodity, currency and stock index futures.
Open interest differs from volume in that volume is the number of contracts actually traded per day, while open interest is the number of contracts entered into, either long or short, that have not been offset by transactions or exercise. They are new or open contracts which may offer clues as to what the traders are anticipating price to do in the asset. This information can be used to assist us in our own trading decisions whether we are trading currency, commodities, futures, options or even stocks.
The COT breaks down open longs and shorts into three categories. We have the Commercials, the non-Commercials and the Non-Reportables. The Commercials are people or businesses who deal directly with the underlying asset such as farmers, miners and international businesses. With commodity futures, they understand the true supply and demand of the asset and are trying to hedge against future price movement that could hurt operating profits. They are not usually trying to profit from the futures contract itself. Stock index futures are used to hedge institutional portfolios and for arbitrage opportunities. The non-commercials are large speculators and can represent “smart money”. They are speculating on the future movement of the trend in the underlying asset. The non-reportable positions are the so called “dumb money”. They are the small individual traders trying to play the direction of the markets for profit, and they are often wrong.
The COT provides the open interest for both longs and shorts for all three categories of traders. Subtract the net shorts from the net longs in each category to see if the commercials, non-commercials and small traders are net long or net short. To use the COT data, you should keep a chart of the data and see what the trend is for the three groups. This is not the simplest task as you will have to manually enter the data each week from the COT report, but it can be beneficial to do so. Are the traders going net long or net short? Are they increasing their longs or their shorts? To trade with the trend, follow the non-commercials. Remember, this is the “smart money” that seeks to profit from price movement in the futures contract. If they are net short and increasing their shorts, look to go short yourself. If they are net long and increasing their net longs, look to open longs as well.
The most powerful trading signal comes when the commercials and non-commercials are trending in one direction while the non-reportables or speculators (small traders) are trending in the opposite. The divergence of these groups shows the professionals taking money from the public and you should follow the professionals for greater probability of success.
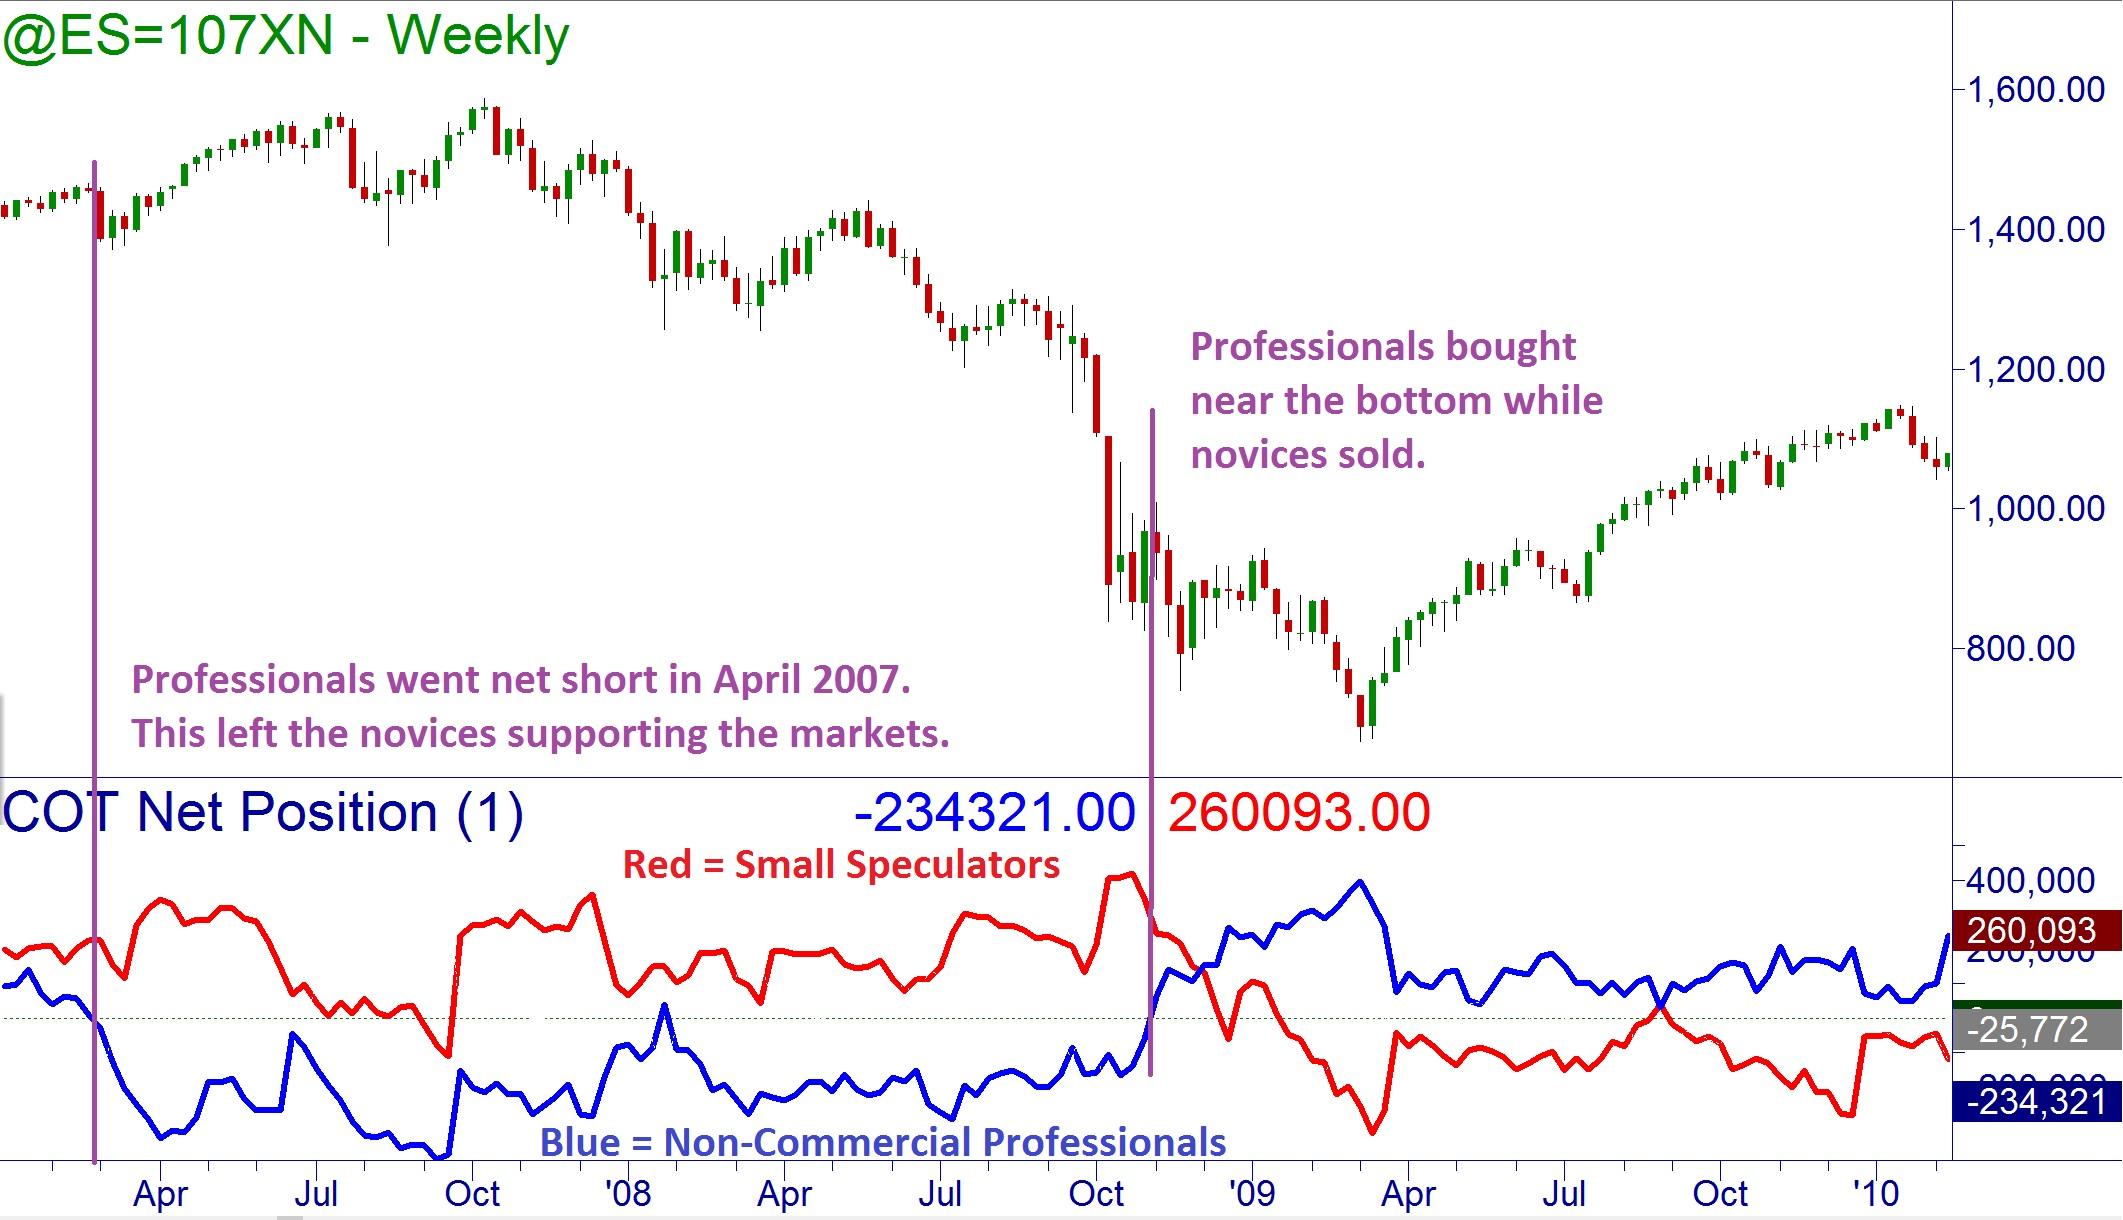
The following chart is from TradeStation and shows the S&P 500 Futures on a weekly chart with the COT Net Position as an indicator below. Looking at the divergences may indicate possible trend changes. The professionals all sold ahead of the market peak in October 2007 while the amateurs continued to buy. A similar picture was painted in early 2009 when the professionals bought ahead of the market bottom while many traders sold off into the decline.
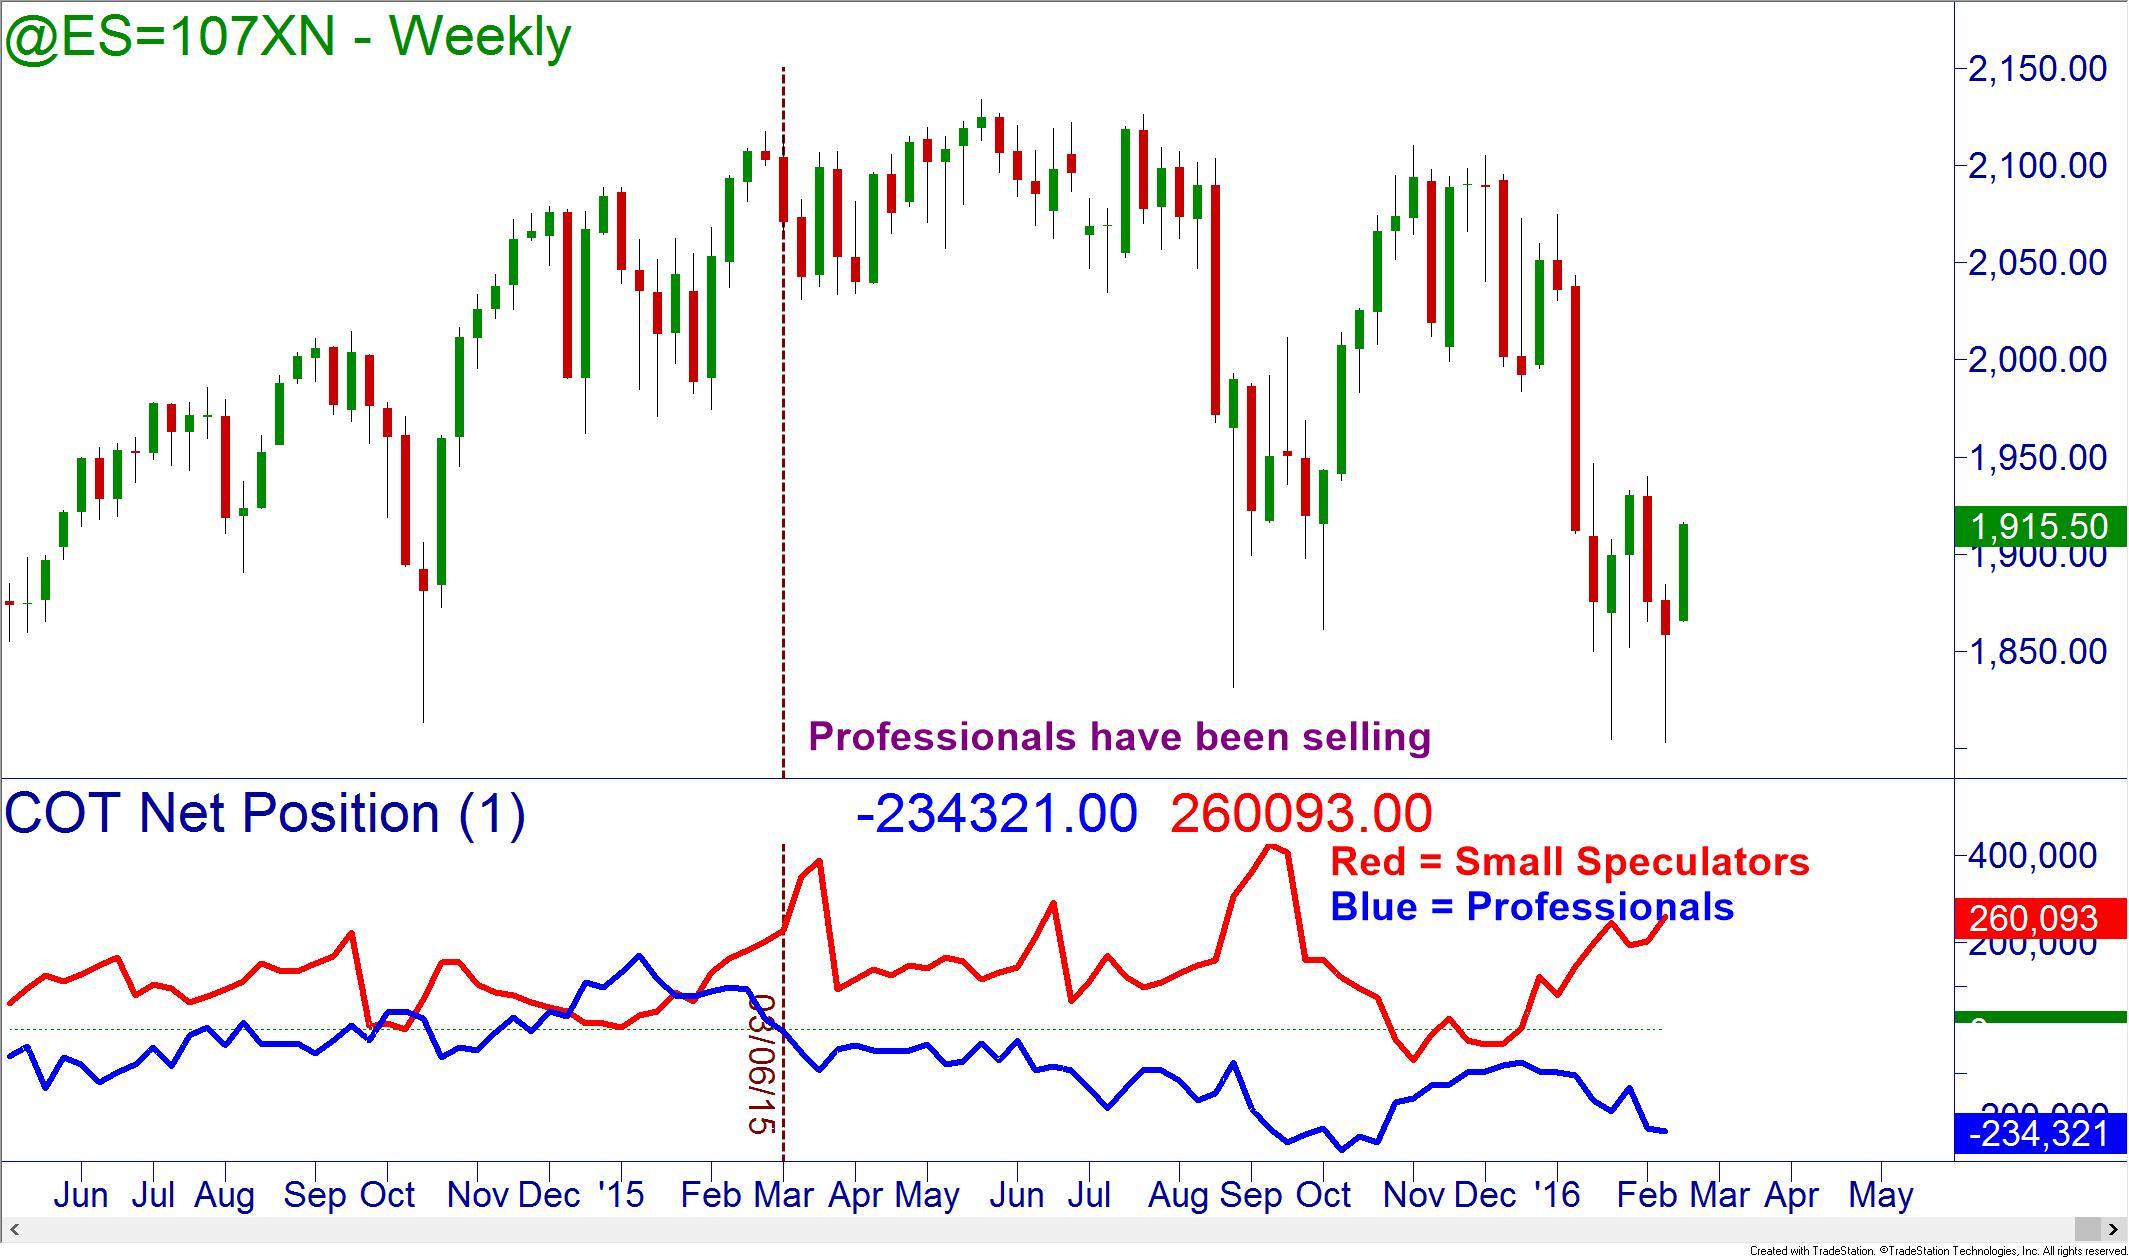
Looking at the current market environment, the S&P 500 rally has been fueled by the small speculators; that includes novice traders. This is not what you want to see if the trend is to last. The Non-Commercial professionals have been exiting the equity markets since the highs in spring 2015, leaving the novices holding the bag.
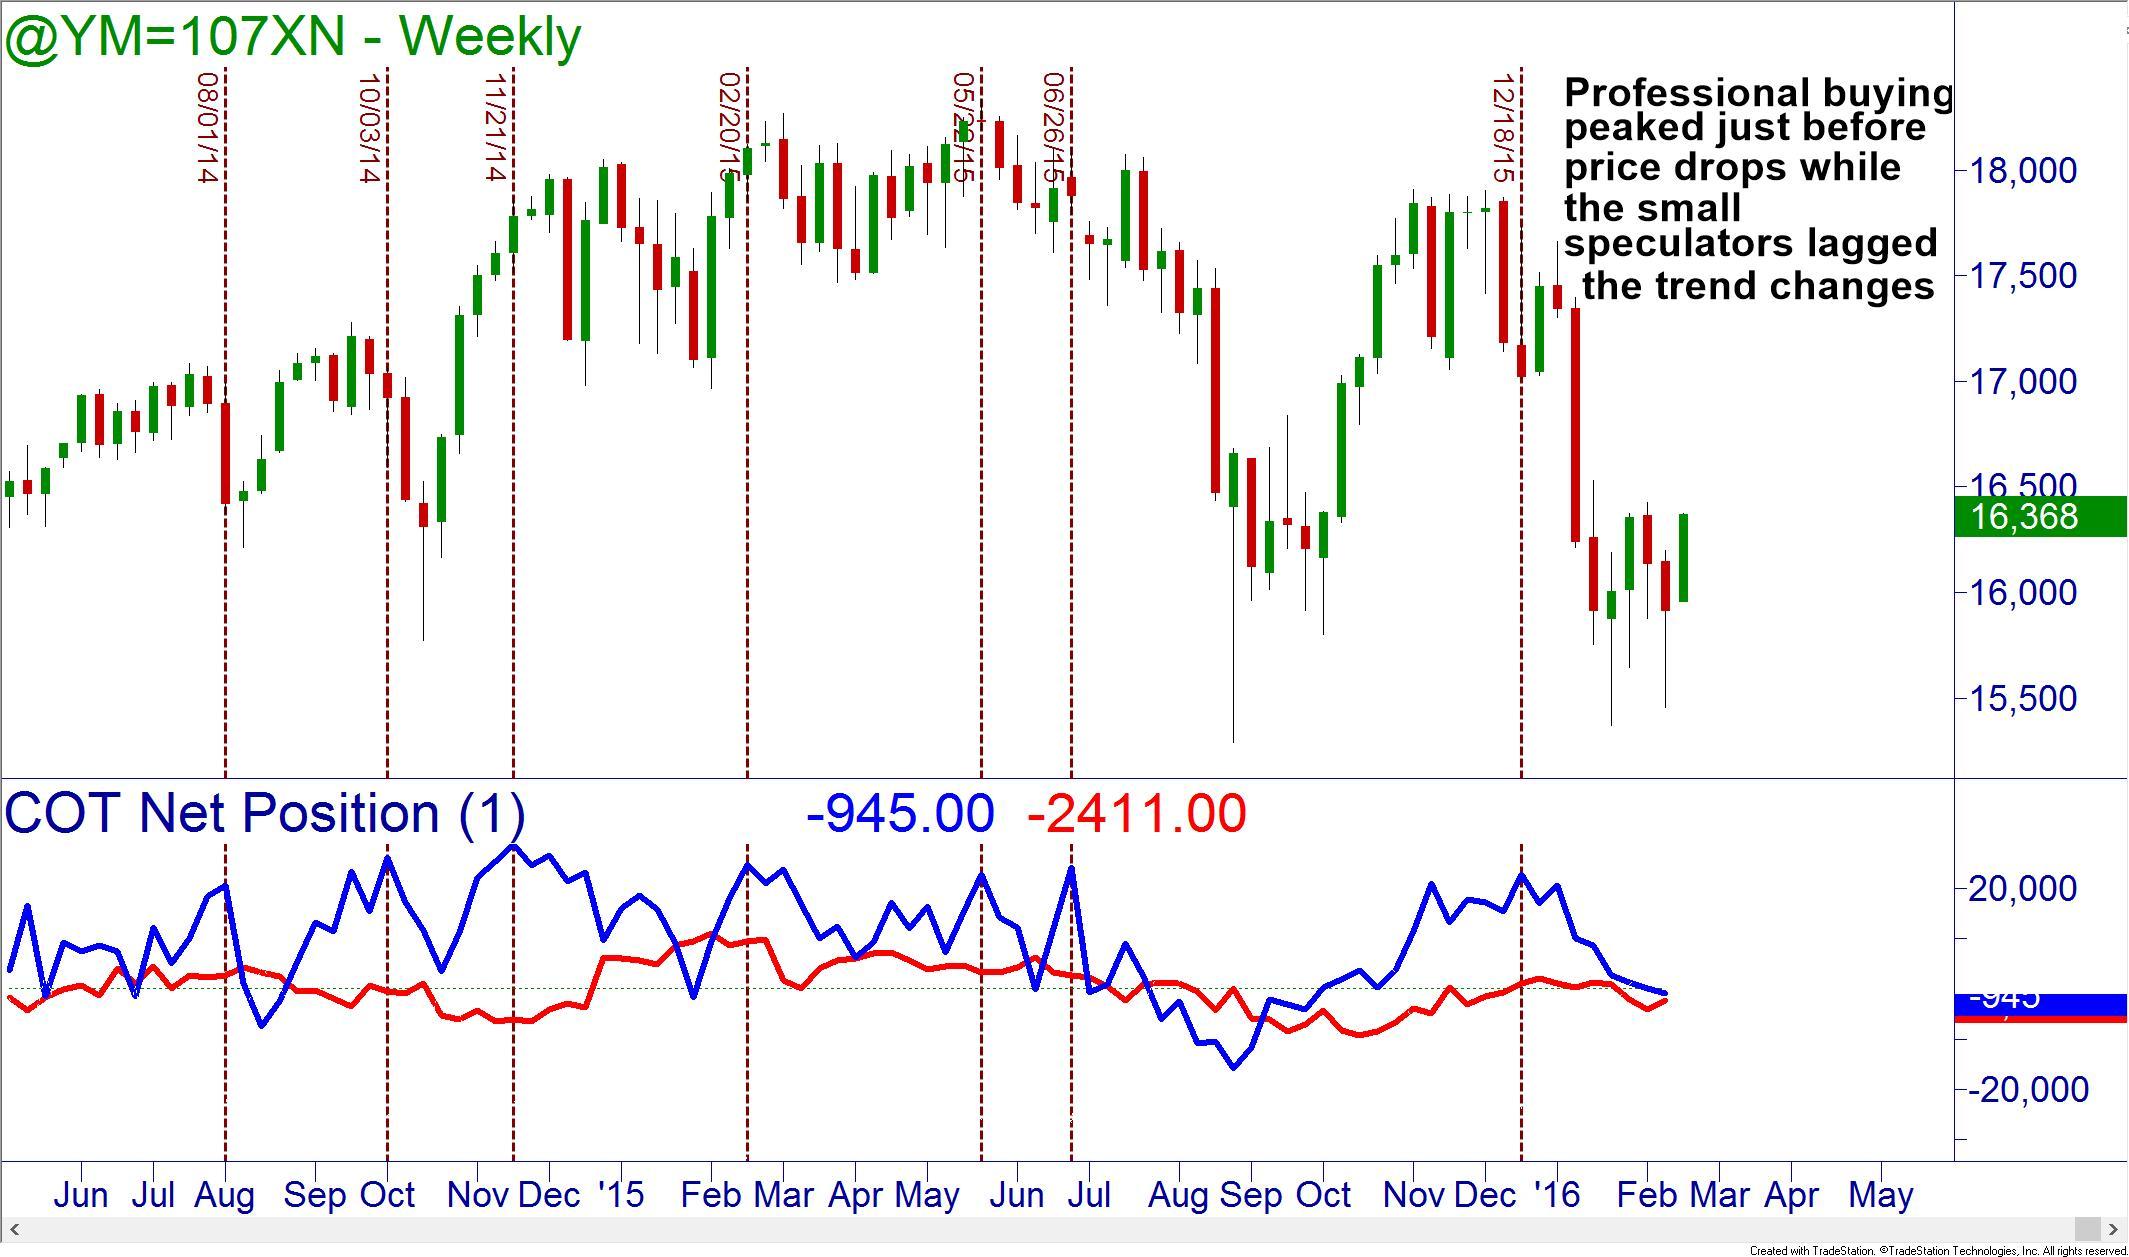
The COT for the Dow is not as dramatic but is still telling. Notice, as the non-commercial professionals peak in their long activity prices soon drop. The small speculators are often lagging the trend change and are on the wrong side of the market.
The markets have been led by buying in the NASDAQ and the Russell 2000. Looking at both of those COTs, we see the exodus of professionals from those index futures too. This shows they do not have faith in the current bullish rally.
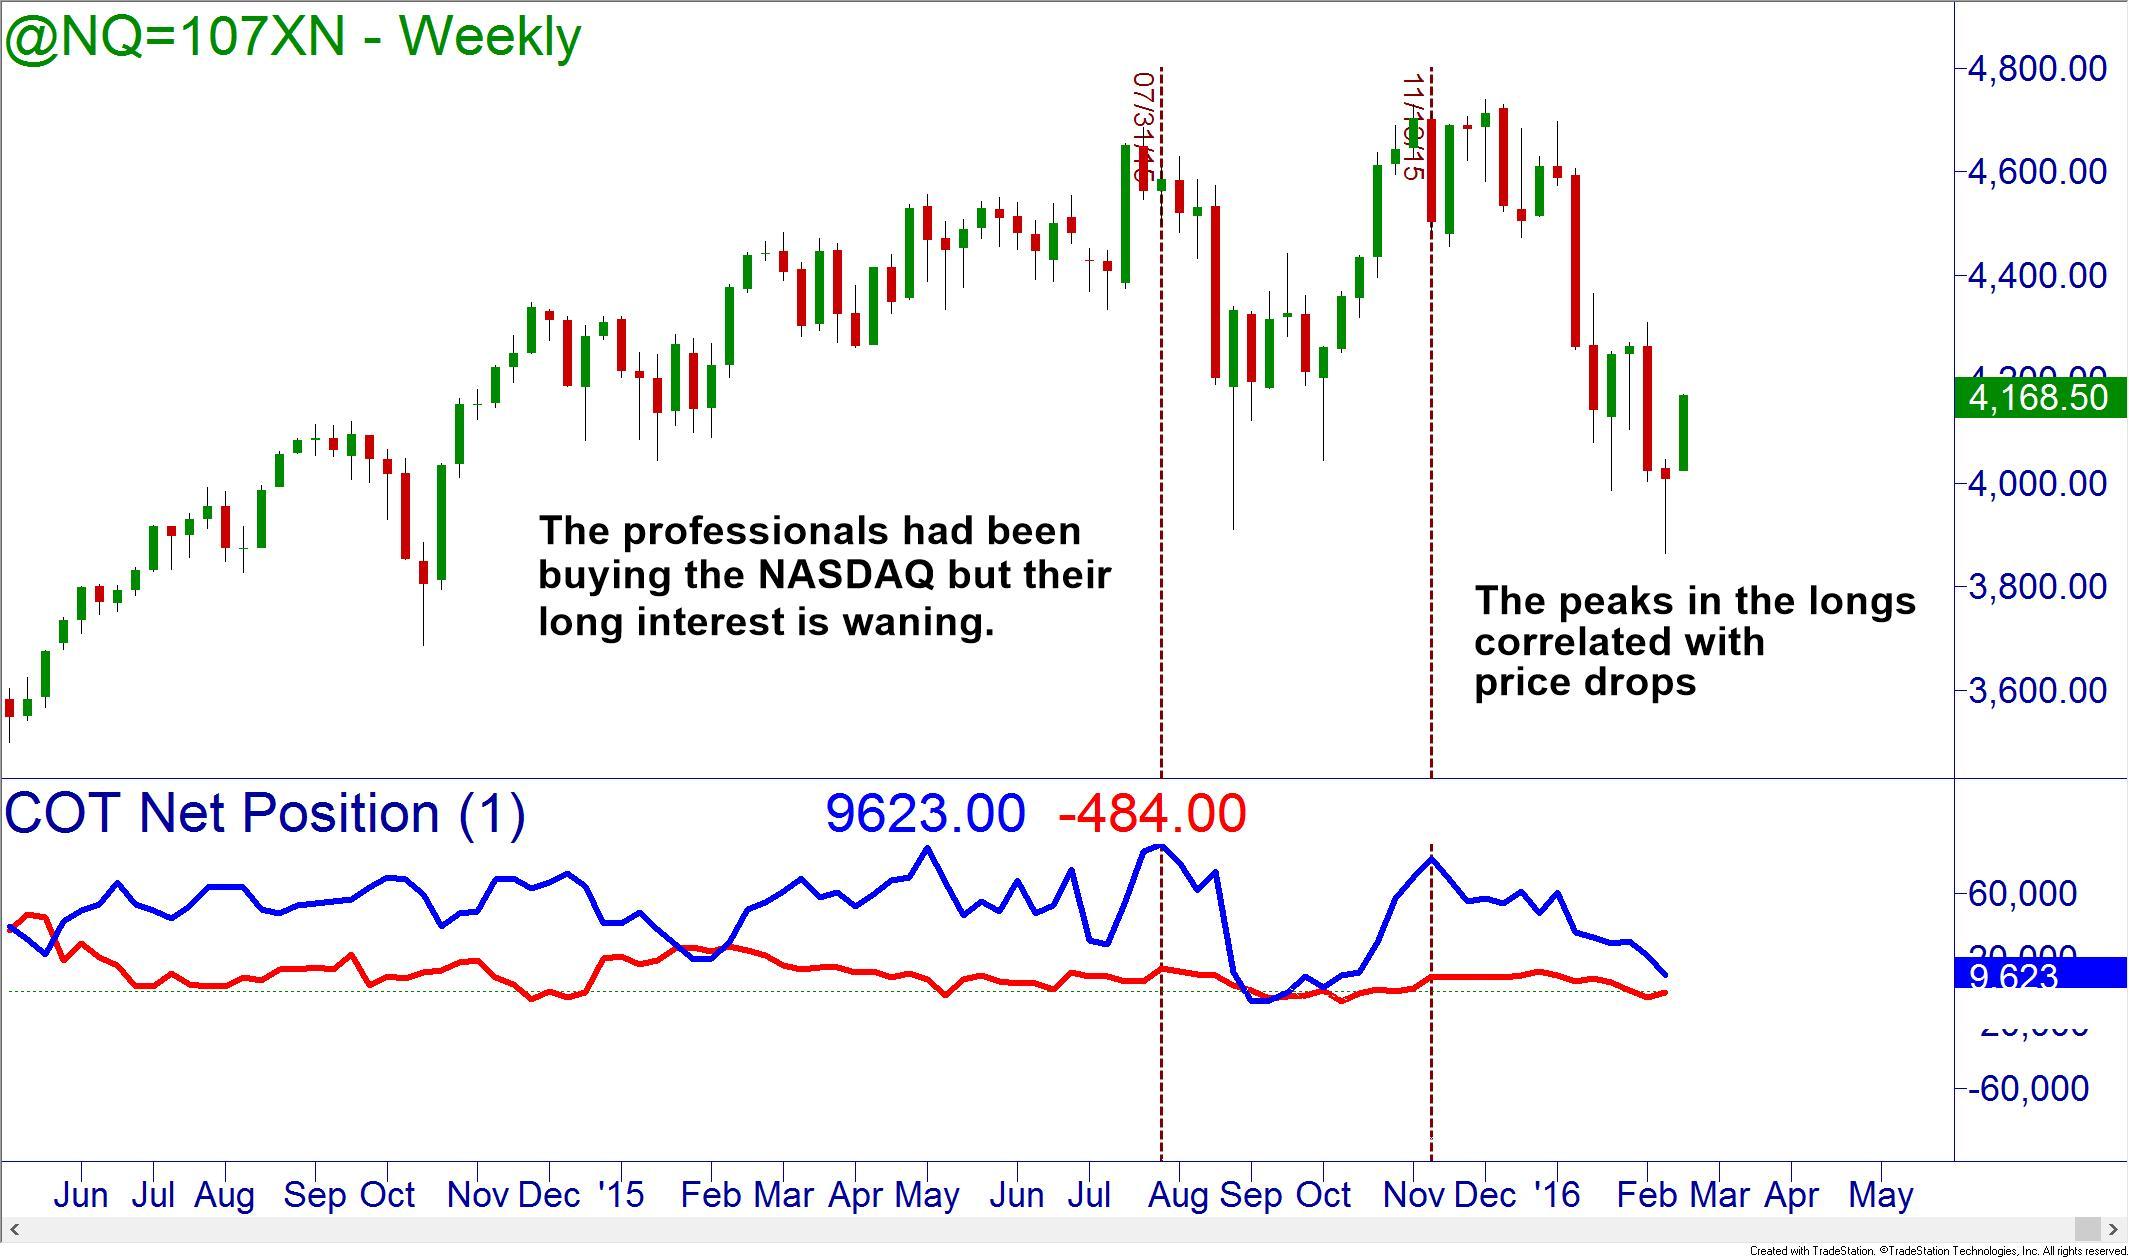
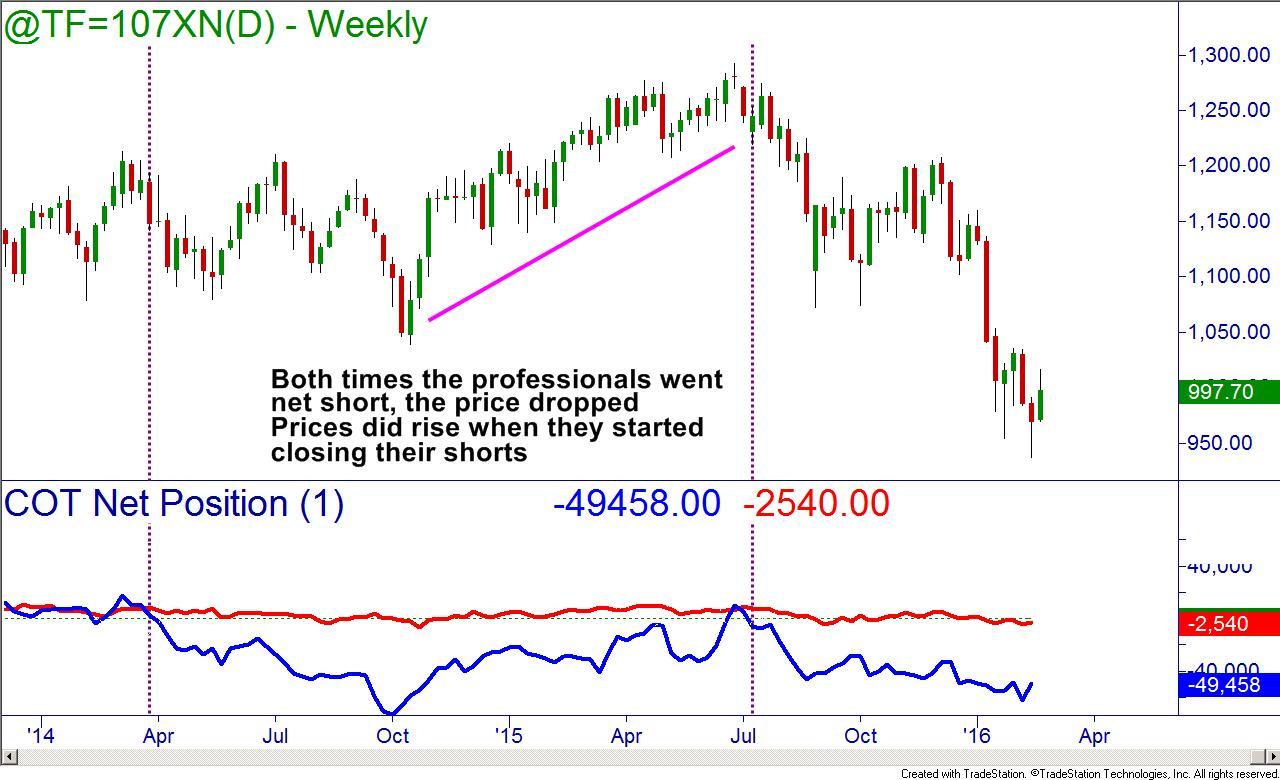
Use the COT to monitor open interest; watching the markets and also the smart money carefully will lead the way. We are nearing a critical breaking point on the US and even world markets. Worries about sovereign debt, fed bailout programs ending, possible negative interest rates ahead, etc. are weighing on everyone’s mind. If you are unsure what to do in this type of market environment, get educated. Volatile markets are not scary if you have knowledge. In fact, they can be extremely profitable; just trade in the direction that the markets and the big boys tell us to.
Information on these pages contains forward-looking statements that involve risks and uncertainties. Markets and instruments profiled on this page are for informational purposes only and should not in any way come across as a recommendation to buy or sell in these assets. You should do your own thorough research before making any investment decisions. FXStreet does not in any way guarantee that this information is free from mistakes, errors, or material misstatements. It also does not guarantee that this information is of a timely nature. Investing in Open Markets involves a great deal of risk, including the loss of all or a portion of your investment, as well as emotional distress. All risks, losses and costs associated with investing, including total loss of principal, are your responsibility. The views and opinions expressed in this article are those of the authors and do not necessarily reflect the official policy or position of FXStreet nor its advertisers.