Looking Forward Market Follow Up
|A few weeks ago I made some bold stock market observations and predictions about the US Equity markets as well as some of the commodity markets. It is time to review those stock market predictions and see where the markets may be headed in the next few weeks to months.
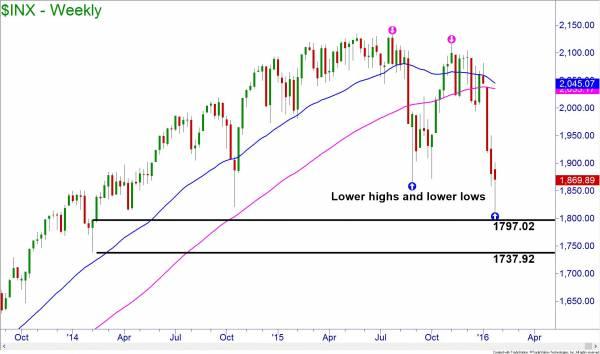
There has been much speculation and talk about whether the United States economy will endure another recession. I cannot answer that for sure, that’s why they are called stock market predictions, but I do know that the S&P 500 index is definitely in a bearish trend on the weekly charts. We have not entered into a bear market as of yet, but are showing all of the classic signs for the start of one.
The S&P 500 did make the lower low after the lower highs and last week bounced just shy of the 1797 demand zone. This is not necessarily a good sign as it may mean that price is building momentum to break that zone.
Even if prices rebound for the next couple of weeks as they will likely do, it will not be enough to stop the 40-week simple moving average from crossing below the 80-week simple moving average which usually marks the start of a bear market.
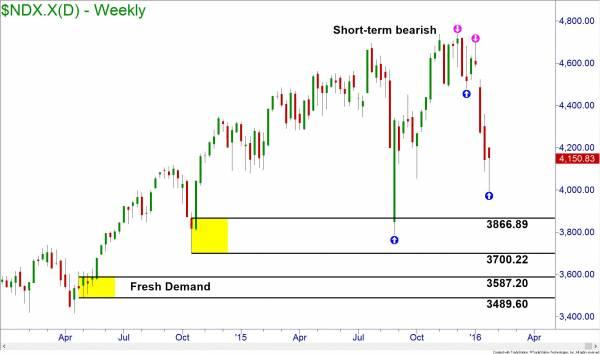
The NASDAQ has been the stronger index but is also weakening. Even though the larger trend has not made lower lows to confirm a bearish trend, in the short-run there have been. Additionally, the August 2015 drop already weakened the demand at 3866 so prices could seek out the 3587 level on the next push down.
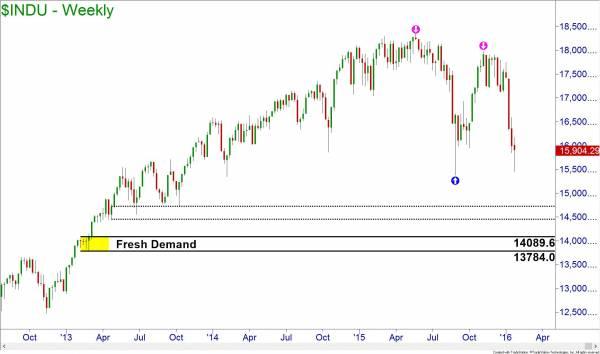
At the big board, the Dow Jones Industrial Average has yet to make lower lows after its lower highs. The bad news is that there is no fresh demand on the weekly charts until 14089.
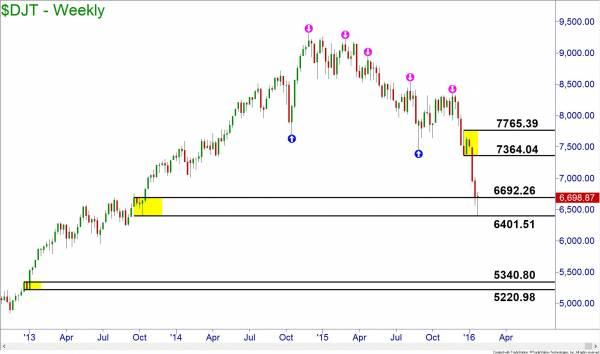
A popular leading index for Dow followers is the Dow Jones Transportation Index. This index has been bearish since late 2014 and has been forecasting price drops for some time. This week, the index tested the 6400 demand zone and has tried to bounce. I expect a retracement to test the supply near 7300 before another drop to the fresh demand at 5340.
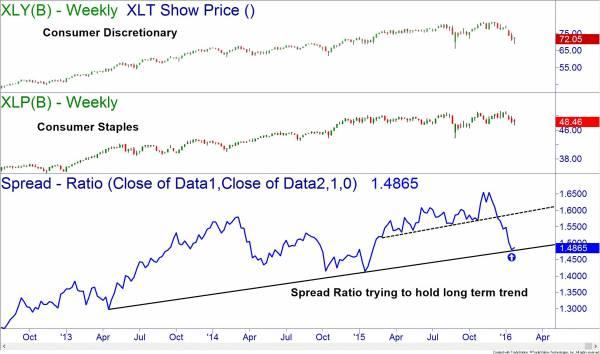
One more helpful indicator that can be used to determine the strength or weakness of the overall equity market is comparing the prices of consumer discretionary stocks to those of consumer staples. The discretionary stocks represent companies that produce goods that are sought after when consumers have extra spending money and are feeling good about the economy. The staples are companies that make things we as consumers need to buy no matter what the shape of the economy. After all, we still use toilet paper in a market crash don’t we?
The Exchange Traded Fund, (ETF), XLY symbolizes the consumer discretionary sector. Its holdings include many of the largest companies in that sector. XLP is the consumer staples ETF. By using a technical analysis tool called Spread Ratio, which is available on TradeStation, I can view the strength and weakness of these two ETF’s against each other.
When the spread ratio line is rising, it means the discretionary stocks are outperforming the staples. This usually occurs when investors and traders are bullish about the market and the economy. When the line is dropping, investors are seeking safety in the staples as they feel the economy and markets are likely to start falling or they are already in a bearish mode.
The ratio held the trend in 2015 even during the August price drop. This did not completely rattle the bulls. However, at the end of the year the ratio broke the trend line. This week it is bouncing from the longer term trend line set in 2013. Should that break, it would be a very ominous sign for the markets.
It appears that the bears are getting settled in but not before one last bull trap is set to spring. Be careful on the rallies in the markets and use them as an opportunity to set up protection for your accounts or look to enter shorts for the new bear.
If you do not know how to do all of this, get educated at your local Online Trading Academy office today!
Information on these pages contains forward-looking statements that involve risks and uncertainties. Markets and instruments profiled on this page are for informational purposes only and should not in any way come across as a recommendation to buy or sell in these assets. You should do your own thorough research before making any investment decisions. FXStreet does not in any way guarantee that this information is free from mistakes, errors, or material misstatements. It also does not guarantee that this information is of a timely nature. Investing in Open Markets involves a great deal of risk, including the loss of all or a portion of your investment, as well as emotional distress. All risks, losses and costs associated with investing, including total loss of principal, are your responsibility. The views and opinions expressed in this article are those of the authors and do not necessarily reflect the official policy or position of FXStreet nor its advertisers.