Broad Market Analysis Using Renko
|A few weeks ago I wrote several articles regarding the Renko charting method. This type of charting can be used to see the larger time frame’s trend on securities and also the broad markets. Renko charting can also be used on smaller time frames in order to enter and exit trades as well.
The US Equity markets have been very choppy since the beginning of the year. To analyze the trend on daily or weekly charts for trading purposes let’s look at them using Renko charts. We know the dominant trend will help traders and investors take positions on the right side of those trends. Trading on the right side of the trend and knowing where the trend is likely to reverse is crucial to success in the markets.
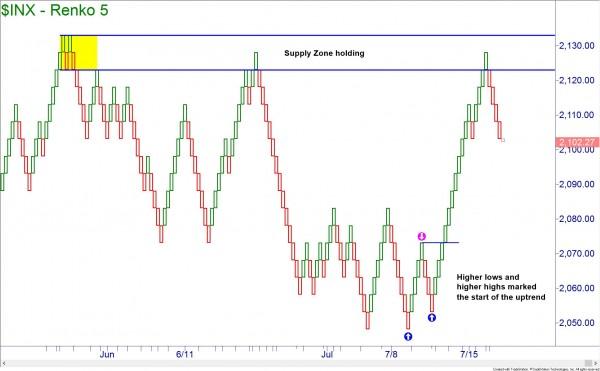
The S&P 500 appears to be holding supply that has been tested once already. You will notice that the uptrend began with higher lows and higher highs. We are not in a downtrend on this index and should not short until a lower low is established after a lower high.
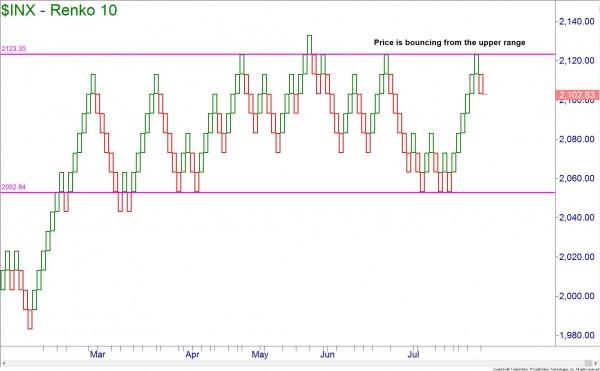
Viewing a larger brick size on the S&P 500 index, we can clearly see the tight range that price has been stuck in for many months. It is no surprise that we have found weakness as price hit the upper portion of the range and is just reverting to the mean as there was no reason to continue making new highs.
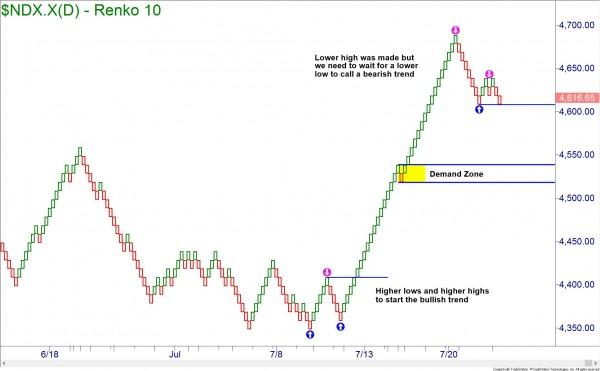
At the time I was writing this article, the Nasdaq 100 was flirting with a trend change. There was a lower high already established but the lower low to confirm a downtrend was still pending. There is also a demand zone near 4540 that could cause a small bounce. A trader would wait to short until the bounce pushes prices into a supply zone.
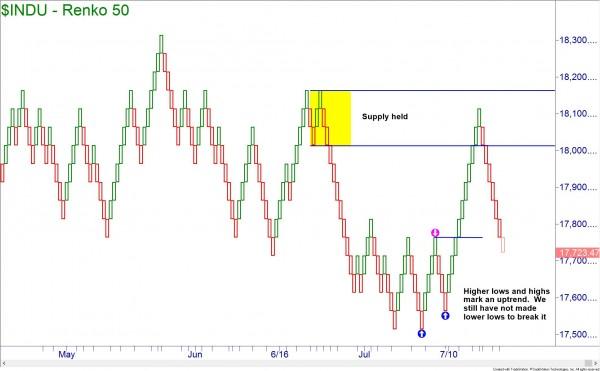
While the Dow has not made lower highs and lows, it is much weaker than the other indexes. The talking heads on TV will blame it on weak earnings, but the supply zone was touched and held before the news was released. This proves that you do not need to watch the news to trade properly.
Just as I mentioned for the Nasdaq, it may be best to wait for lower highs and lower lows in the Dow before looking for longer term shorting positions. Currently, we would only look for intraday shorts as smaller trends have turned bearish.
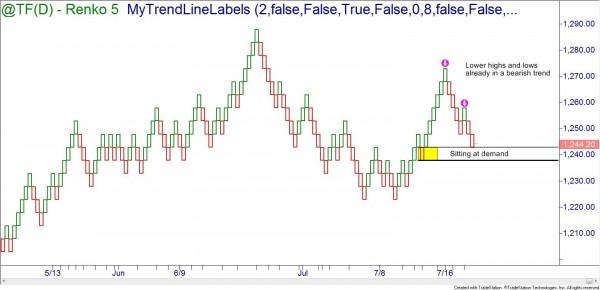
The market that usually leads major trend is the small cap Russell 2000. This index has already been showing a lot of weakness and a downtrend.
As I write this article, the Russell 2000 is sitting at a demand zone. I would not be surprised to see a small bounce, but with the bearish trend established this should serve as an opportunity to short the bounces into a supply zone.
In conclusion, the markets are showing weakness. They have not confirmed a trend reversal to end the bull-run but have at least shown there is room for movement downward for a couple of weeks. A trader could look at shorting these markets on an intraday basis but would only want to take swing trade shorts if high quality opportunities present themselves.
Information on these pages contains forward-looking statements that involve risks and uncertainties. Markets and instruments profiled on this page are for informational purposes only and should not in any way come across as a recommendation to buy or sell in these assets. You should do your own thorough research before making any investment decisions. FXStreet does not in any way guarantee that this information is free from mistakes, errors, or material misstatements. It also does not guarantee that this information is of a timely nature. Investing in Open Markets involves a great deal of risk, including the loss of all or a portion of your investment, as well as emotional distress. All risks, losses and costs associated with investing, including total loss of principal, are your responsibility. The views and opinions expressed in this article are those of the authors and do not necessarily reflect the official policy or position of FXStreet nor its advertisers.