Investor Trend Indicator
|During a recent Extended Learning Track course, one of the students brought up a technique I used to discuss for helping investors to better identify the broad market trend. This is a simple technique and I honestly forgot where I had learned it from. It involves using two simple moving averages on the chart of the S&P 500 Index.
The first thing to remember is that this is not a timing technique. It is only to help you see how strong or weak the current trend is and when an investor may want to move assets toward safety or be more aggressive. Moving averages are a trend following technical analysis tool. They are created by averaging past closing prices. Since we are using past prices, we are seeing what the trend was, not necessarily will be.
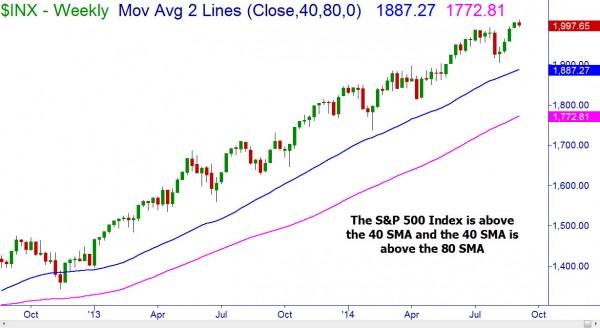
To use this particular technique, start with a weekly chart of the S&P 500 Index. Place both a 40 week simple moving average (SMA) and an 80 week SMA on the chart. If the market is bullish, price should be above the 40 SMA. The 40 week SMA should also be higher than the 80 week SMA.
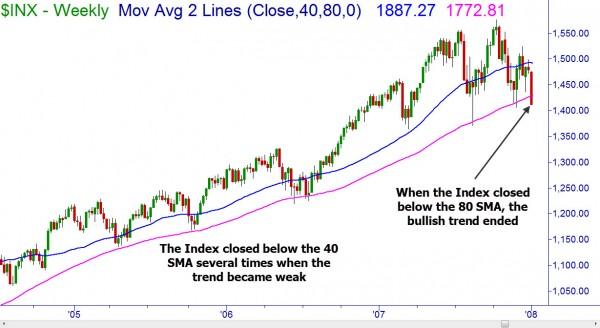
The first sign of trend weakness would occur when the price of the S&P 500 closes below the 40 week SMA. This should not cause the investor to panic or sell their holdings. Rather the trader should ensure that stops are in place and watch for any signs of continued weakness. An alarm begins when the S&P 500 closes below the 80 week SMA. This will have occurred well after the index has fallen from its highs but before a large crash occurs.
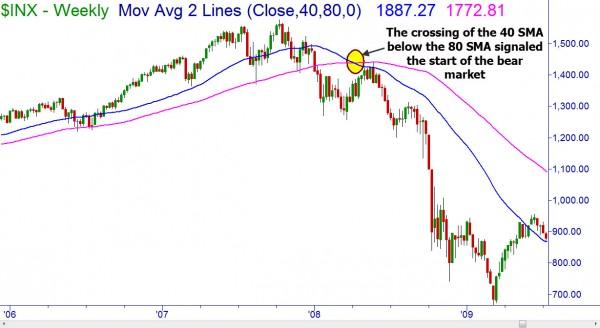
A bear market is signaled when the 40 week SMA finally crosses below the 80 week SMA. When this happens, the equity markets usually move down quickly and for an extended period of time. An investor should look to trade those securities that thrive in bearish markets when this crossover occurs. They can sell futures, buy puts, or even invest in inverse ETF’s.
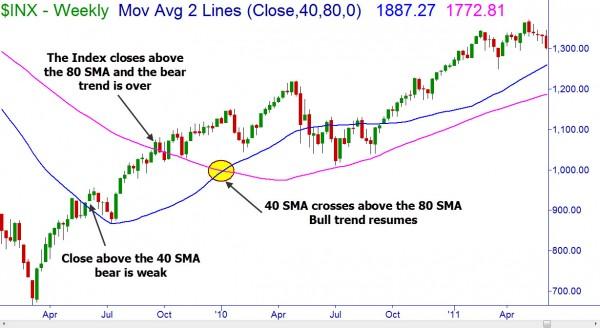
The same rules apply for bearish markets as they did for bullish. Once the S&P 500 index finally closes above the 40 week SMA, the bearish trend is weakening. Should the index close above the 80 week SMA then the bear trend is usually ending. The return of the bull market is finally welcomed by the crossing of the 40 week SMA above the 80 week SMA.
I have seen these SMA’s work well with the S&P 500 Index to help identify major changes in the market’s trend. I do not use them for individual stocks or other securities as I have not found them to be as accurate as they are on the major market index itself.
You should also keep in mind that this technical analysis technique is not a perfect science. There will be false alarms and an investor should not rely on it alone for the decision making process. Learn how to protect your money and grow your capital at Online Trading Academy.
Information on these pages contains forward-looking statements that involve risks and uncertainties. Markets and instruments profiled on this page are for informational purposes only and should not in any way come across as a recommendation to buy or sell in these assets. You should do your own thorough research before making any investment decisions. FXStreet does not in any way guarantee that this information is free from mistakes, errors, or material misstatements. It also does not guarantee that this information is of a timely nature. Investing in Open Markets involves a great deal of risk, including the loss of all or a portion of your investment, as well as emotional distress. All risks, losses and costs associated with investing, including total loss of principal, are your responsibility. The views and opinions expressed in this article are those of the authors and do not necessarily reflect the official policy or position of FXStreet nor its advertisers.