Comparison for a Trading Advantage
|In the Extended Learning Track program we have been watching the broad markets for influence on individual stocks. I have been demonstrating a method of watching the broad market indexes that reduces the need for multiple charts. I have decided to revisit an article I wrote a while ago that describes this method.
Those of you who have attended Online Trading Academy’s Professional Trader Course know that we always have a chart of the S&P 500 or NASDAQ to view in addition to our stock chart in the class. On average, 50-60% of a stock’s movement will be directly related to the movement and trend of the broad market. 30-40% of the stock’s movement will be influenced by the sector of that stock. That leaves only 10% of influence from the company itself.
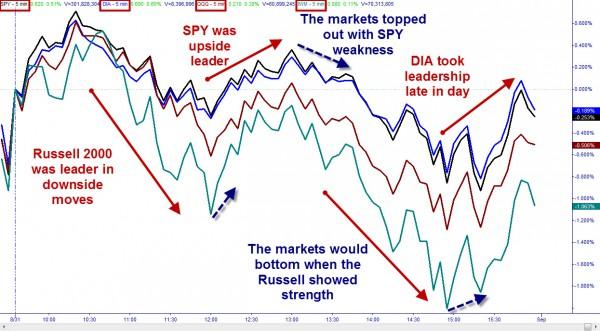
I am sure you have noticed that the stocks moving with the market trend often move faster and farther than those trying to move against it. The other choice we must make is which market should we be following, the S&P 500, the NASDAQ, DJIA, or the Russell 2000? It comes down to which of those indexes is leading in the current trend. Most traders would suffer from information overload from trying to watch the charts of those four indexes as well as their stocks. I have found a solution for keeping an eye on the markets while focusing on your stock trade.
TradeStation software allows me to chart the four indexes in one chart. This is something I have used extensively in the XLT programs to identify market trend and potential confirmation at supply and demand levels. I use the “Percent Change” feature to compare all four indexes and easily identify the leader in the dominant trend. I like to use the ETF’s: SPY, QQQ, DIA & IWM to represent all of the indexes. You could easily substitute the indexes themselves or even the futures contracts. Since the futures are listed on different exchanges, you will have to adjust your chart to local time instead of “Exchange” time for them to overlay. You can see the finished chart below.
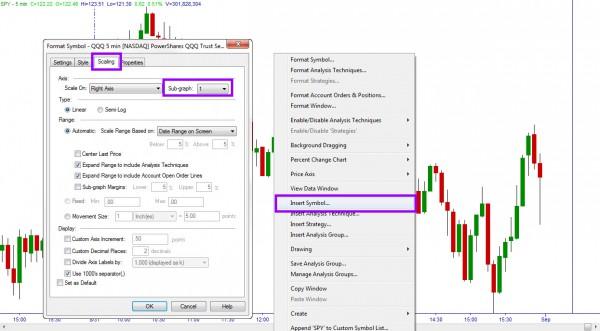
To create the chart, I start with a chart of the S&P 500. If you right click on the chart you can select “Insert Symbol” and then add the next ETF to your chart. You need to make sure you have the “Prompt for Format box checked when you add the symbol. You will need to go to the Scaling Tab and change the Sub-Graph to 1.
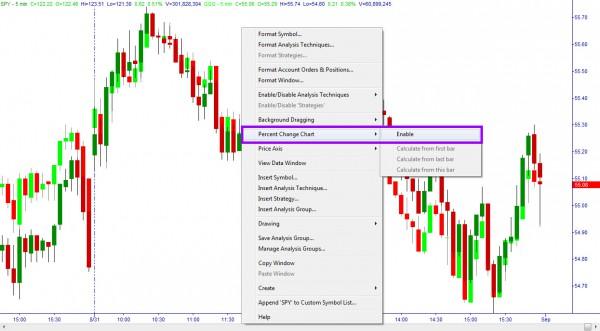
Once you have the second symbol on the chart, you will right click again and select “Percent Change Chart” and select “Enable.”
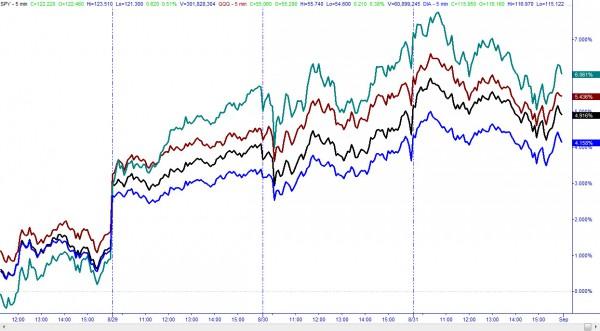
You can then add the additional ETF’s one at a time in the same manner. You can change the style and color of the lines when you add them if you keep the “Prompt for Format” box checked. Once all four are added your chart will look like this.
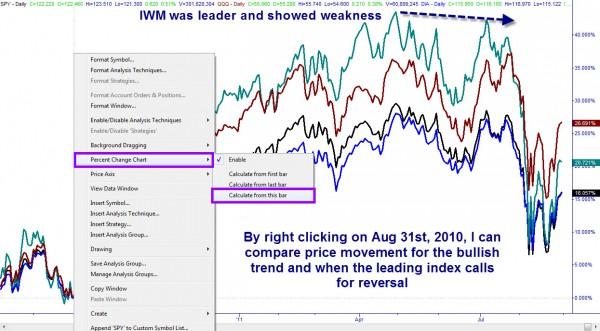
Finally, you must choose a starting point for the comparison. On intraday charts, I use the open. I right click on the chart at the line that represents the beginning of the day. Under the “Percent Change Chart” menu, I select “Calculate from This Bar.” That will start the price comparisons at zero from the open of the day. If I am using a daily chart or want to compare a longer move, I will start the chart from a major top or bottom and see when the trend is weakening from the leading index changing direction.
For more information on how we can use this tool, come join me in the Extended Learning Track of Online Trading Academy or even attend the Advanced Technical Analysis course. The skills you will pick up in these classes can greatly improve your trading.
Information on these pages contains forward-looking statements that involve risks and uncertainties. Markets and instruments profiled on this page are for informational purposes only and should not in any way come across as a recommendation to buy or sell in these assets. You should do your own thorough research before making any investment decisions. FXStreet does not in any way guarantee that this information is free from mistakes, errors, or material misstatements. It also does not guarantee that this information is of a timely nature. Investing in Open Markets involves a great deal of risk, including the loss of all or a portion of your investment, as well as emotional distress. All risks, losses and costs associated with investing, including total loss of principal, are your responsibility. The views and opinions expressed in this article are those of the authors and do not necessarily reflect the official policy or position of FXStreet nor its advertisers.