Channeling trends in stocks
|By Bramesh Bhandari
Price moves in trends. Trends can be extremely short-term, down to the tick level, or month-long steady climbs (or falls) in a stock’s value. The tools we use to predict or detect these trends are as varied as the time frames on which they appear. As you would expect, some tools are more appropriate for certain time frames than others.
Trendlines are one of the simpler tools. These basic lines, drawn roughly along price lows to indicate support in uptrends or along price highs to indicate resistance in downtrends, identify general market price direction. They provide excellent guidance during clean and persistent price trends.
However, such qualities are not always in place. Often, trends play out in fits and starts, surging ahead only to give back several points before resuming the move in the predominant direction. For these moves, it is more difficult to see where price is headed. We need to turn to a tool that is more sensitive to price changes that are inconsistent over time.
The commodity channel index (CCI) is an oscillator designed to be effective in these environments. Don’t be confused by the use of the word “commodity” in the name. This oscillator, popularized by Donald Lambert, works perfectly well on stocks. It measures the variation of a security’s price from its statistical mean. This variation can hold clues to a change in price trend.
Lambert’s basic assumption is that tradable assets, such as stocks and commodities, move in cycles. CCI helps by indicating when an asset has moved too far above its mean for the trend to sustain (overbought condition), or has become too cheap for sellers to maintain necessary selling pressure (oversold condition). These levels can, in turn, be used to generate buy and sell signals against the recent move.
CCI calculation
There are four steps in the calculation of the CCI:1. Calculate the typical price (TP). Add each period’s high, low and close and divide by three: TP = (H+L+C)/3
2. Calculate the n-period simple moving average of the typical price (SMATP). Traders generally use a 20-period SMA because on average there are 20 trading days in a month.
3. Calculate the mean deviation (MD). First, calculate the absolute value of the difference between the last period’s SMATP and the typical price for each of the past 20 periods. Add all of these absolute values together and divide by 20 to find the mean deviation.
4. The final step is to apply the TP, the SMATP, the MD and a constant (0.015) to the following formula: CCI = (TP – SMA) / 0.015 x MD
There are three basic applications of the CCI indicator in trading:
- Zero-line crossover
- Overbought and oversold levels
- Trading divergence (positive and negative)
We’ll discuss each of the above methods in detail, elaborating with examples.
Trading with the CCI
One of the simplest applications of the CCI is a zero-line crossover. As the CCI generally varies within the +100 to –100 range, any move above +100 or below –100 shows an unexceptional strength or weakness that can extend itself further. The zero-line is precisely in the middle of these extremes. Traders use the zero-line cross as a potential entry point under the assumption that trend bias has shifted from negative to positive, or vice versa, and is headed toward one of the extremes.A word of caution, however. Actively trading on every zero-line crossover can result in numerous whipsaws, particularly if the stock is currently range bound. As long as we are prepared to accept that risk, the following are some basic, unfiltered trade rules for a zero-line crossover:
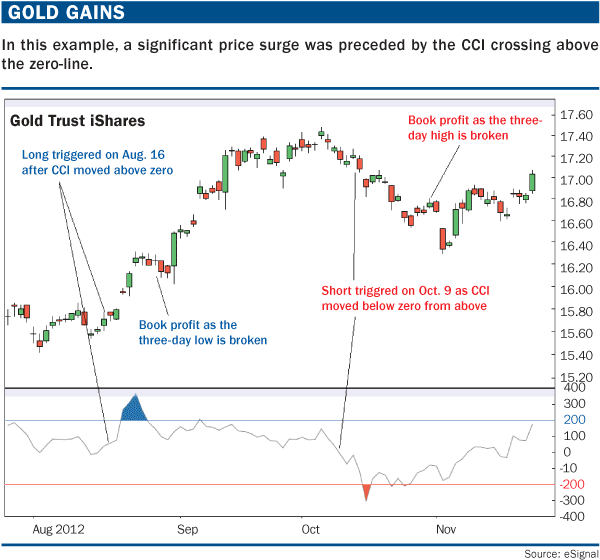
Buy when the CCI crosses its zero-line from below, setting a stop loss at the previous day’s low. If the market runs higher as expected, profit should be booked once price gives back enough of the new uptrend to break the three-day low.
Sell when the CCI crosses its zero-line from above, setting a stop loss at the previous day’s high. If the market falls as expected, profit should be booked once price gives back enough of the new downtrend to break the three-day high.
“Gold gains” (below) shows the iShares Gold Trust (IAU) exchange-traded fund (ETF) with a 20-day CCI on the daily time frame. On Aug. 15, 2012, IAU closed at $15.62 after making a low of $15.58 with the CCI at –2.72. On Aug. 16, the ETF opened at $15.65 and the CCI moved into positive territory, giving us a signal to initiate the trade with a stop loss of $15.58. The ETF rallied, made a high of $16.31, and the CCI kept moving until it reached 369. As per our exit rule, we took profits on a break of the three-day low, which was triggered Aug. 30 when $16.19 was broken.
Overbought/oversold
The CCI also is effective as an overbought and oversold indicator. It oscillates between two extremes. High readings imply an overbought condition (shorts can be taken) and low readings imply an oversold condition (longs can be taken). However, identifying overbought and oversold levels can be tricky with the CCI because of the following reasons:The CCI technically has no high or low limit as per the traditional calculation.
Markets can remain overbought or oversold for extended periods of time.
Regarding the level to use, typically +100 and –100 work when trading a stock in a trading range, while higher levels, such as +200 and –200, are necessary during trending moves.
Using overbought/oversold levels effectively also depends on the volatility of the underlying security. For example, the CCI range for ETFs generally is lower when compared to individual stocks such as Apple and Google. Here are some trading rules for overbought/oversold readings during a trending market:
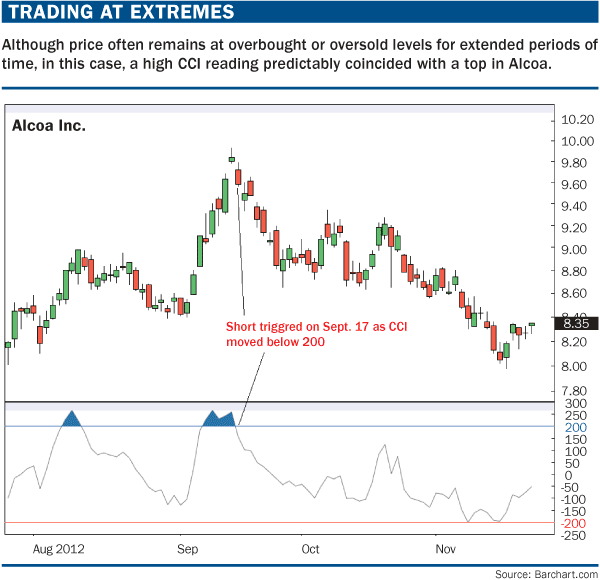
Buy when the CCI turns up from below –200 with a stop loss as the previous day’s low. Profit should be booked on a break of the subsequent three-day low.
Sell when the CCI turns down from above 200 with a stop loss as the previous day’s high. Profit should be booked on a break of the subsequent three-day high.
“Trading at extremes” (below) shows Alcoa Inc. (AA) with a 20-day CCI on a daily time frame. On Sept. 14, 2012, Alcoa closed at $9.84 after making a high of $9.93 and a low of $9.78, with the CCI at 259.65. On Sept. 17, the stock opened at $9.72 and the CCI moved below 200, giving us a signal to initiate the trade with a stop loss of $9.93. The stock started its correction and made a low of $8.65. As per our profit-taking rule, we exit the stock on a break of the three-day low, which was triggered on Sept. 26 when $8.81 was broken.
Trading divergences
Divergence occurs when the security’s price makes a new high while the CCI fails to surpass its previous high. Divergences probably are the least common of the three signals, but usually are the most reliable and lead to the biggest moves. There are two types of divergences:A positive divergence occurs when the CCI begins to advance and the security is still in a downtrend and makes a lower reaction low.
A negative divergence forms when the security advances or moves sideways and the CCI declines. The negative divergence in CCI can take the form of either a lower-high or a straight decline.
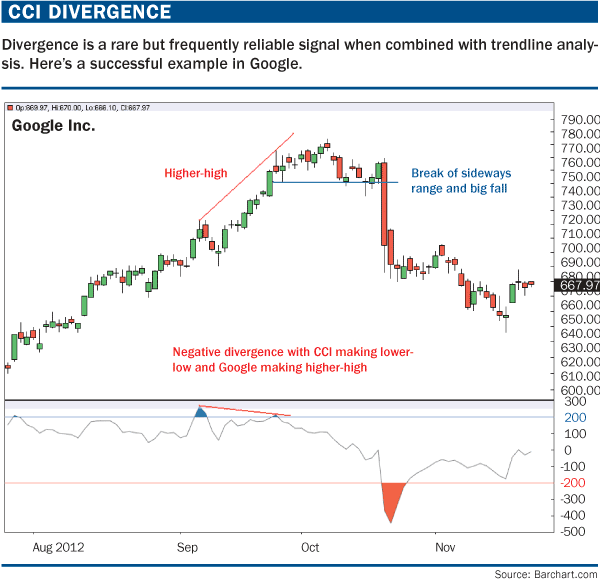
Confirmation is necessary for a successful divergence trade. Positive divergence is confirmed with a break above the zero-line or the break of a downtrend line on the price chart. Similarly, negative divergence is confirmed with a break below the zero-line or a break of an uptrend line on the price chart.
“CCI divergence” (below) shows Google Inc. (GOOG) with a 20-day CCI on the daily time frame. On Sept. 7, 2012, Google closed at $712.25 and the CCI at 265.68. After Sept. 7, Google continued its rise and made a high of $774.68 on Oct. 5, but the CCI was at 107.88, showing a significant negative divergence with price making a higher-high and the CCI indicator making a lower-low. Negative divergence demonstrated its value on Oct. 18 when Google broke the price support of $740 and went into a freefall mode after results were declared that fell short of market expectations.
Price moves in trends, and while traditional price chart tools such as trendlines and moving averages can signal important shifts in sentiment, more sophisticated indicators are useful across varying conditions. The CCI is one such tool. It offers multiple ways to analyze price movements, and it works well with confirming indicators, such as trendlines, to forecast major moves.
Information on these pages contains forward-looking statements that involve risks and uncertainties. Markets and instruments profiled on this page are for informational purposes only and should not in any way come across as a recommendation to buy or sell in these assets. You should do your own thorough research before making any investment decisions. FXStreet does not in any way guarantee that this information is free from mistakes, errors, or material misstatements. It also does not guarantee that this information is of a timely nature. Investing in Open Markets involves a great deal of risk, including the loss of all or a portion of your investment, as well as emotional distress. All risks, losses and costs associated with investing, including total loss of principal, are your responsibility. The views and opinions expressed in this article are those of the authors and do not necessarily reflect the official policy or position of FXStreet nor its advertisers.