XMR/USD technical analysis: Monero holds of 50.000 but for how long?
|- Monero underperforms the rest of the crypto markets and it moves to the bottom of the technical pattern.
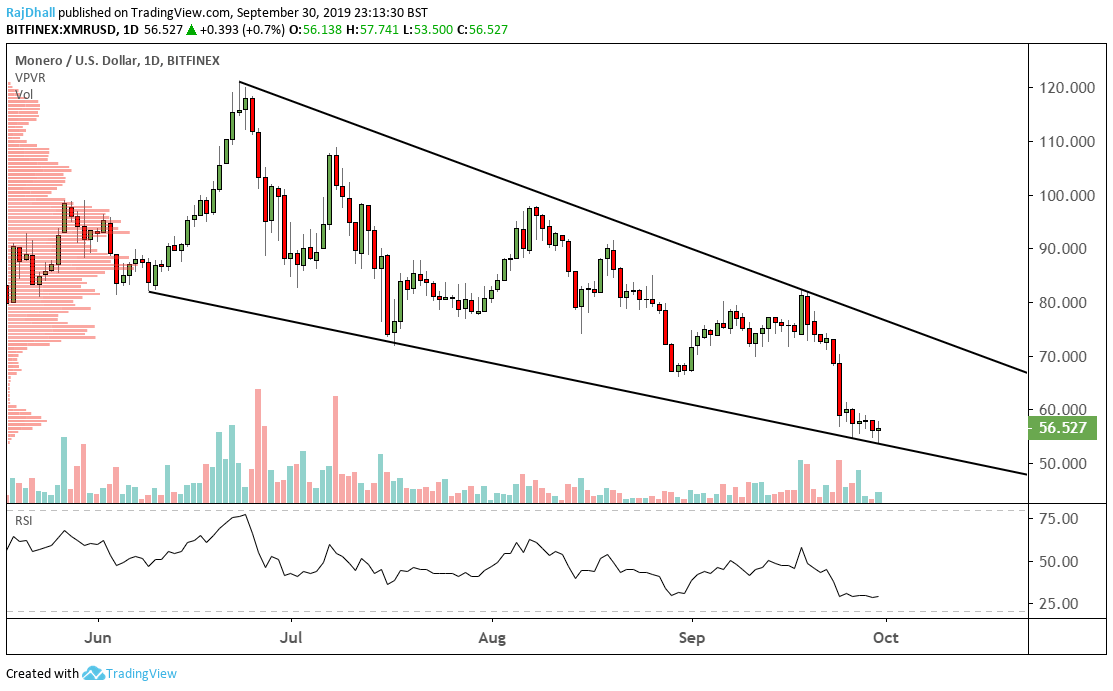
- Since June XMR/USD has fallen from 120.00 down to 56.000 a massive 53%.
XMR/USD is in a clear downtrend and in around five months has lost a massive 53%.
It does look like XMR is trying to base out but the price is hugging the bottom of the falling wedge pattern.
The relative strength indicator (RSI) is still depressed but is not at oversold levels just yet.
The resistance level that traders are looking out for is the psychological 60 point.
Information on these pages contains forward-looking statements that involve risks and uncertainties. Markets and instruments profiled on this page are for informational purposes only and should not in any way come across as a recommendation to buy or sell in these assets. You should do your own thorough research before making any investment decisions. FXStreet does not in any way guarantee that this information is free from mistakes, errors, or material misstatements. It also does not guarantee that this information is of a timely nature. Investing in Open Markets involves a great deal of risk, including the loss of all or a portion of your investment, as well as emotional distress. All risks, losses and costs associated with investing, including total loss of principal, are your responsibility. The views and opinions expressed in this article are those of the authors and do not necessarily reflect the official policy or position of FXStreet nor its advertisers.