TRX/USD Technical Analysis: TRON meets resistance at an internal trendline
|- TRON is trading 4.5% higher on the session as crypto sentiment improved on Wednesday.
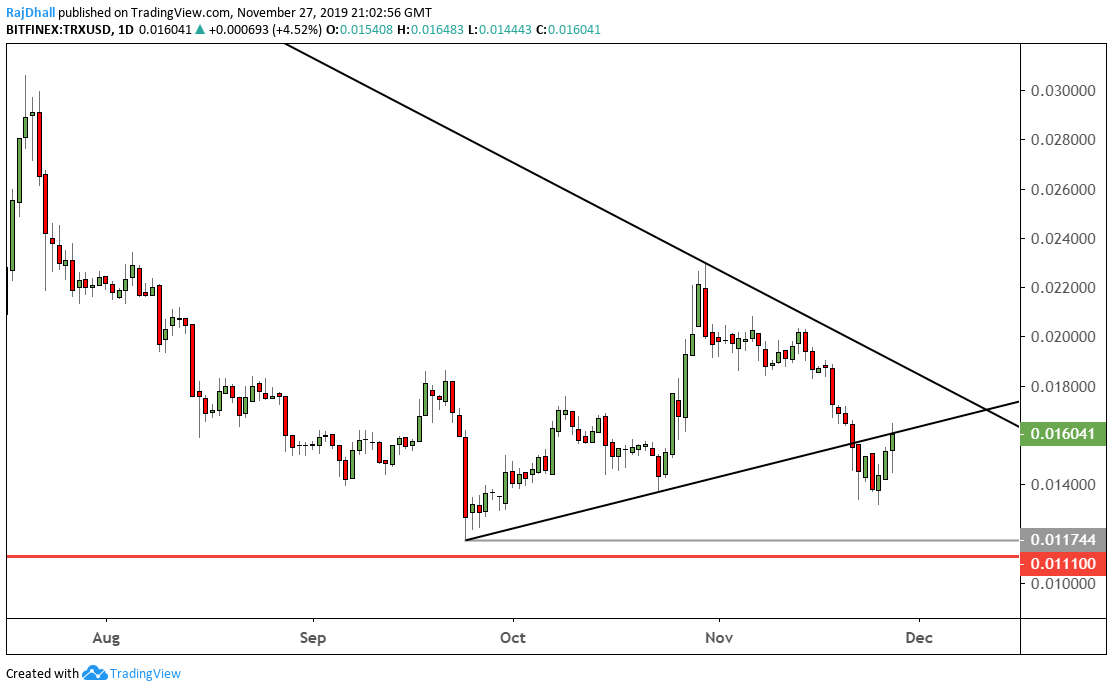
- The price is now stuck at the internal trendline highlighted on the chart.
TRX/USD Daily Chart
The TRX/USD price structure was more bullish than most of the other cryptocurrencies during the fall on 22nd November.
Now it seems that the price has run into some trouble at the internal trendline which originated in late September on the chart below.
The line connects the two higher lows after the September 24th low of 0.01174 bottom.
If the daily candle closes above the next resistance could be the target on the way up at 0.01850.
On the intraday 4-hour chart you can see the price made a similar inverse head and shoulders pattern much like Bitcoin and Bitcoin Cash.
Information on these pages contains forward-looking statements that involve risks and uncertainties. Markets and instruments profiled on this page are for informational purposes only and should not in any way come across as a recommendation to buy or sell in these assets. You should do your own thorough research before making any investment decisions. FXStreet does not in any way guarantee that this information is free from mistakes, errors, or material misstatements. It also does not guarantee that this information is of a timely nature. Investing in Open Markets involves a great deal of risk, including the loss of all or a portion of your investment, as well as emotional distress. All risks, losses and costs associated with investing, including total loss of principal, are your responsibility. The views and opinions expressed in this article are those of the authors and do not necessarily reflect the official policy or position of FXStreet nor its advertisers.