Travala Technical Analysis: AVA/USD explodes again with a 50% price surge hitting $2.4
|- AVA/USD is up 34% in the last 24 hours and has created a new all-time high.
- Travala is seeing a significant increase in trading volume, although overall is still low.
Travala is now ranked 95th by market capitalization with an $85 million mcap. The digital asset is trading at $2.22 after another massive breakout from $1.63. AVA managed to create a clear daily bull flag that had healthy consolidation and now finally another clear leg up.
AVA/USD daily chart
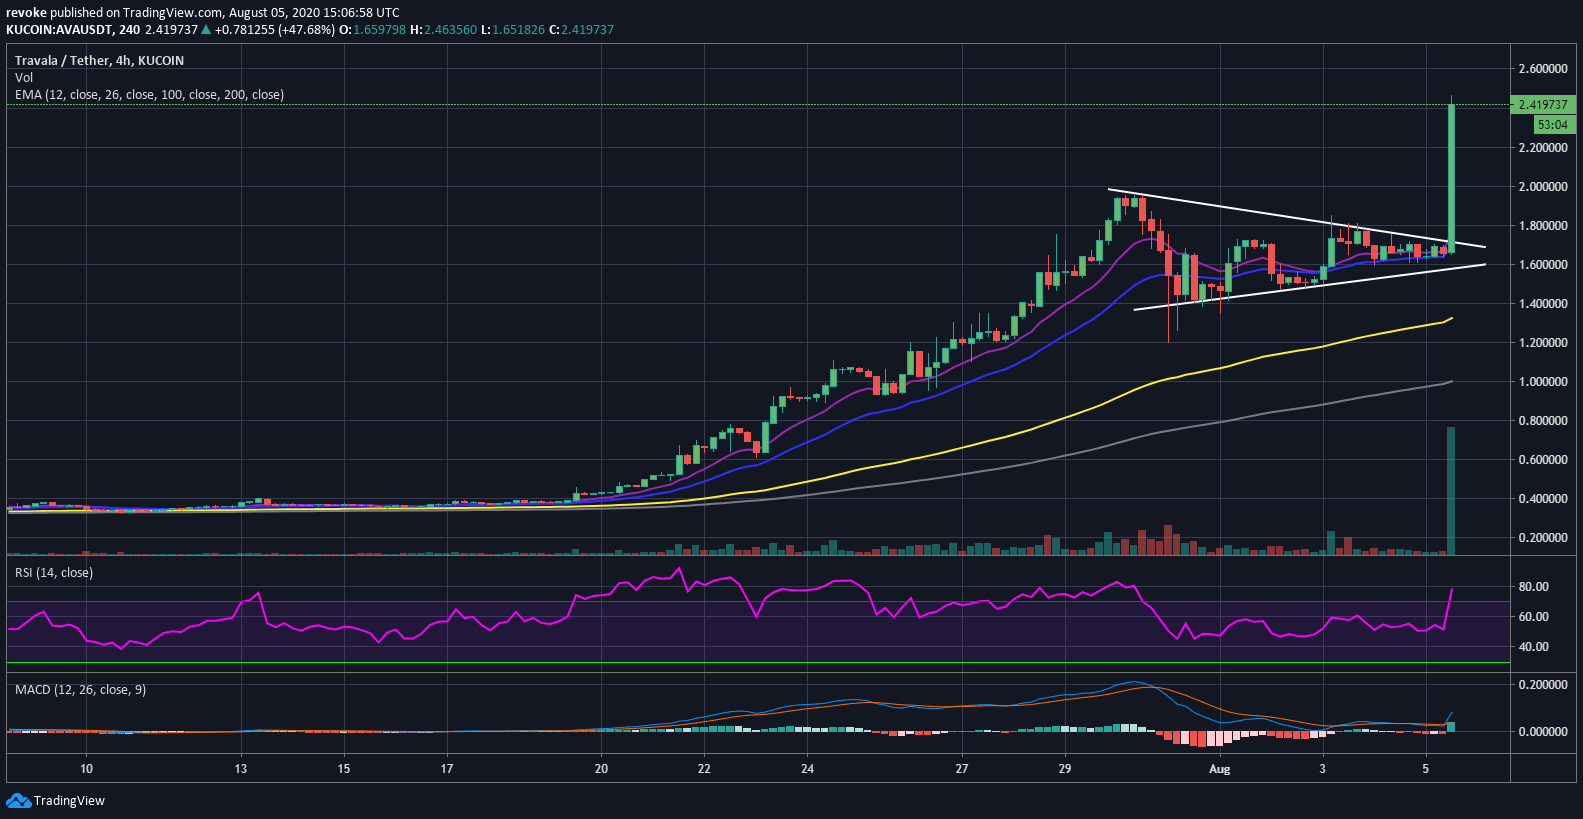
Considering this is the all-time high for AVA, bulls are not facing many resistance levels to the upside. The RSI is overextended again but will not necessarily pose a threat to AVA in the short-term. The MACD has remained bullish since the initial breakout on July 19.
AVA/USD 4-hour chart
The breakout was a bit more obvious on the 4-hour chart seeing that AVA was trading inside a tightening range.
Information on these pages contains forward-looking statements that involve risks and uncertainties. Markets and instruments profiled on this page are for informational purposes only and should not in any way come across as a recommendation to buy or sell in these assets. You should do your own thorough research before making any investment decisions. FXStreet does not in any way guarantee that this information is free from mistakes, errors, or material misstatements. It also does not guarantee that this information is of a timely nature. Investing in Open Markets involves a great deal of risk, including the loss of all or a portion of your investment, as well as emotional distress. All risks, losses and costs associated with investing, including total loss of principal, are your responsibility. The views and opinions expressed in this article are those of the authors and do not necessarily reflect the official policy or position of FXStreet nor its advertisers.