Tezos Price Prediction: XTZ aiming for a 10% price jump if key support is defended
|- XTZ is currently trading at $2.10 after a 7% drop in the past 24 hours.
- The digital asset seems to be contained inside an ascending parallel channel.
The past week for Tezos hasn’t been great, the digital asset lost around $300 million in market capitalization as Bitcoin continues gaining dominance over the market. Despite the downtrend, bulls are defending a critical support level that can greatly help XTZ.
XTZ looks for a bounce towards $2.3
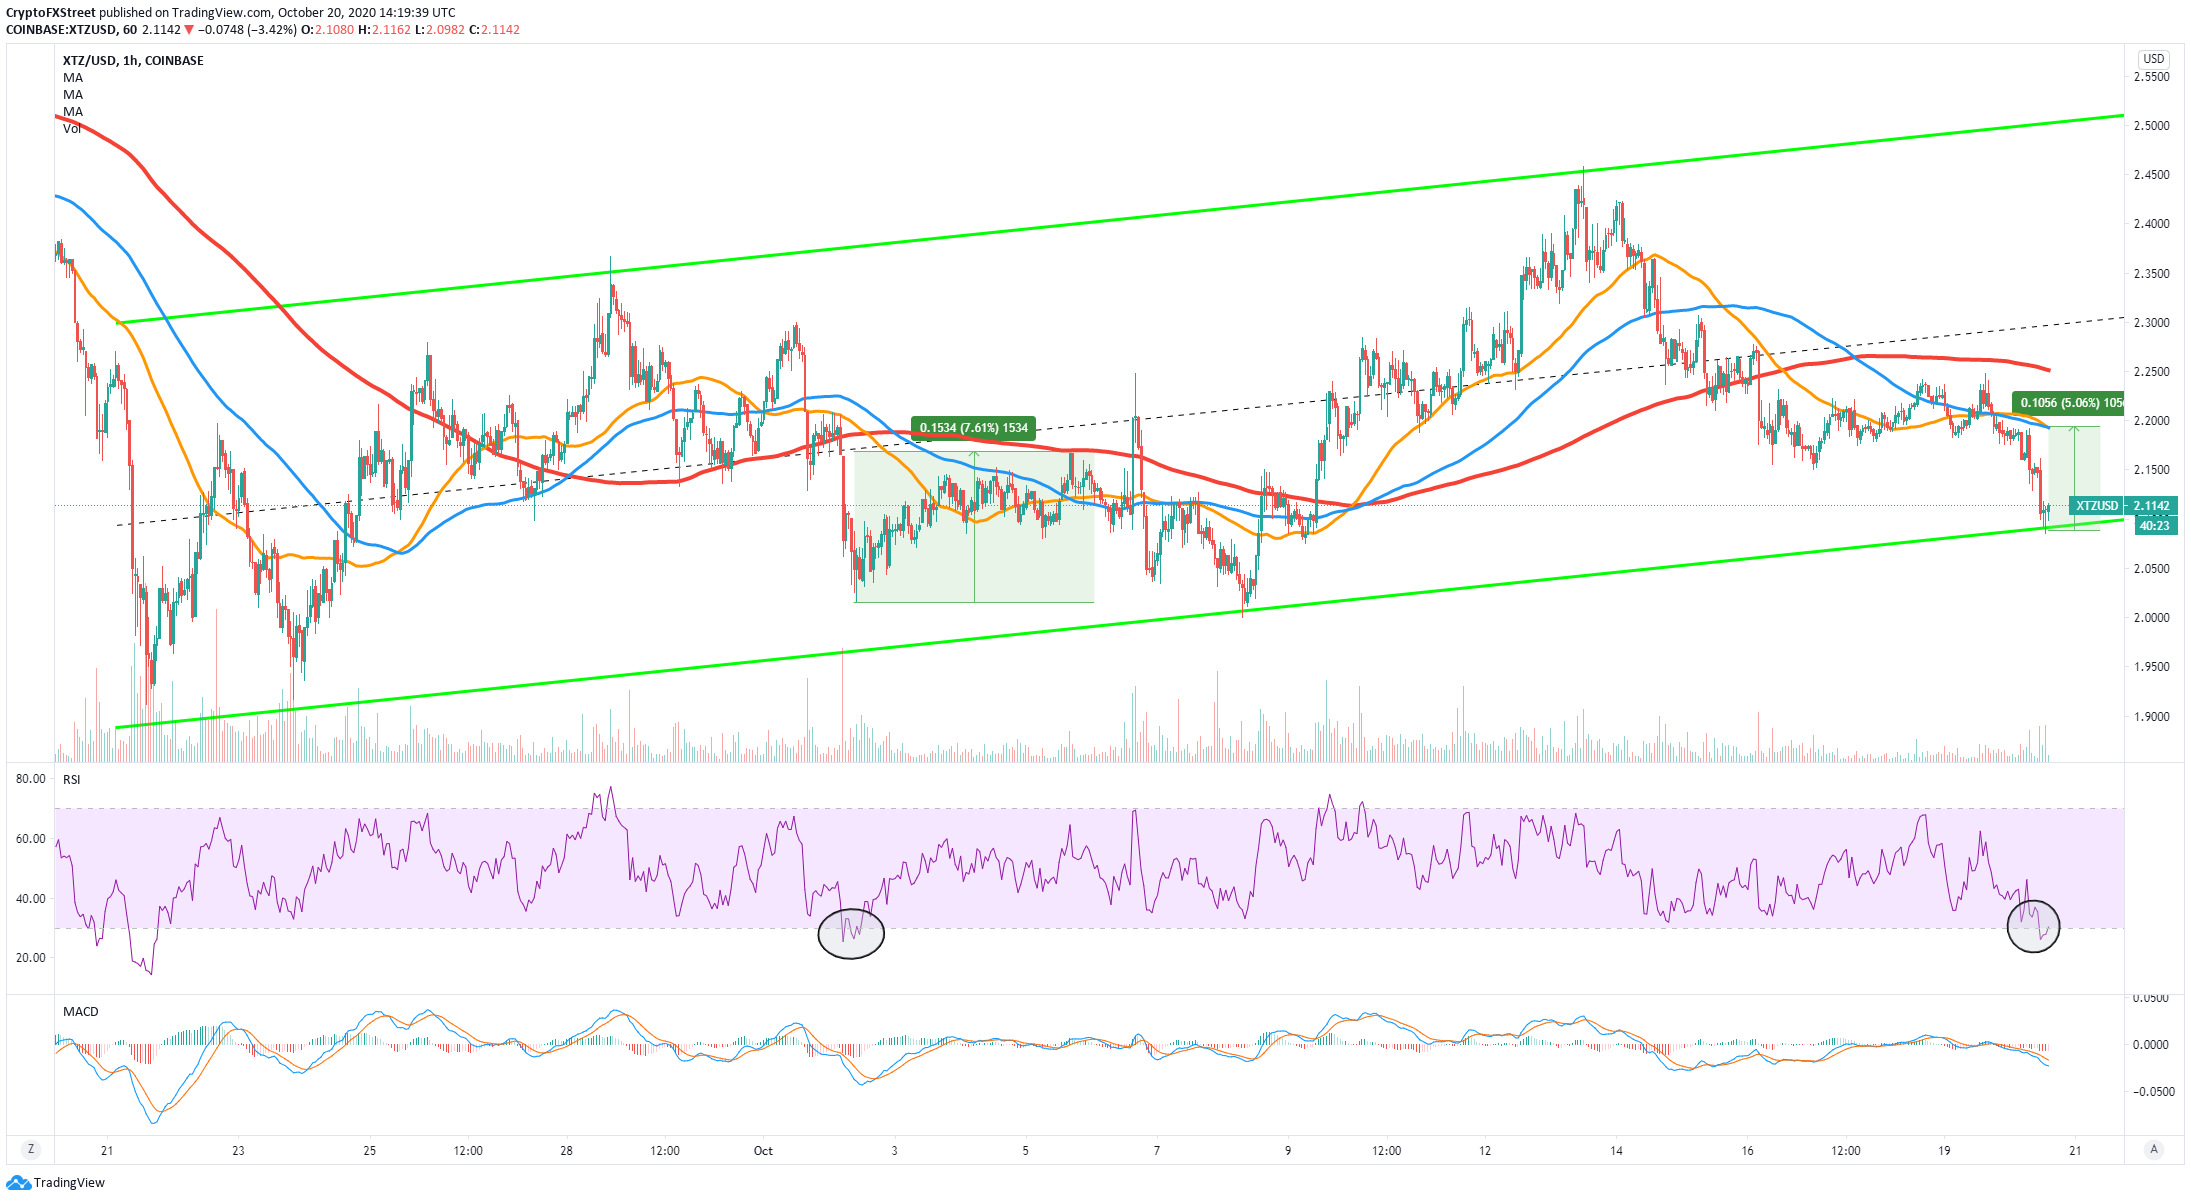
On the hourly chart, the price of XTZ seems to have formed an ascending parallel channel with its lower boundary right below the current price. Bulls are desperately trying to defend the critical support level at $2.09 to see a bounce.
XTZ/USD 1-hour chart
The RSI is overextended for the first time since October 2, when XTZ saw a 7% price explosion within the next 24 hours of the indicator touching oversold. If the bulls can successfully defend the lower boundary of the pattern, Tezos can climb towards $2.2 where the 50-SMA and the 100-SMA are located.
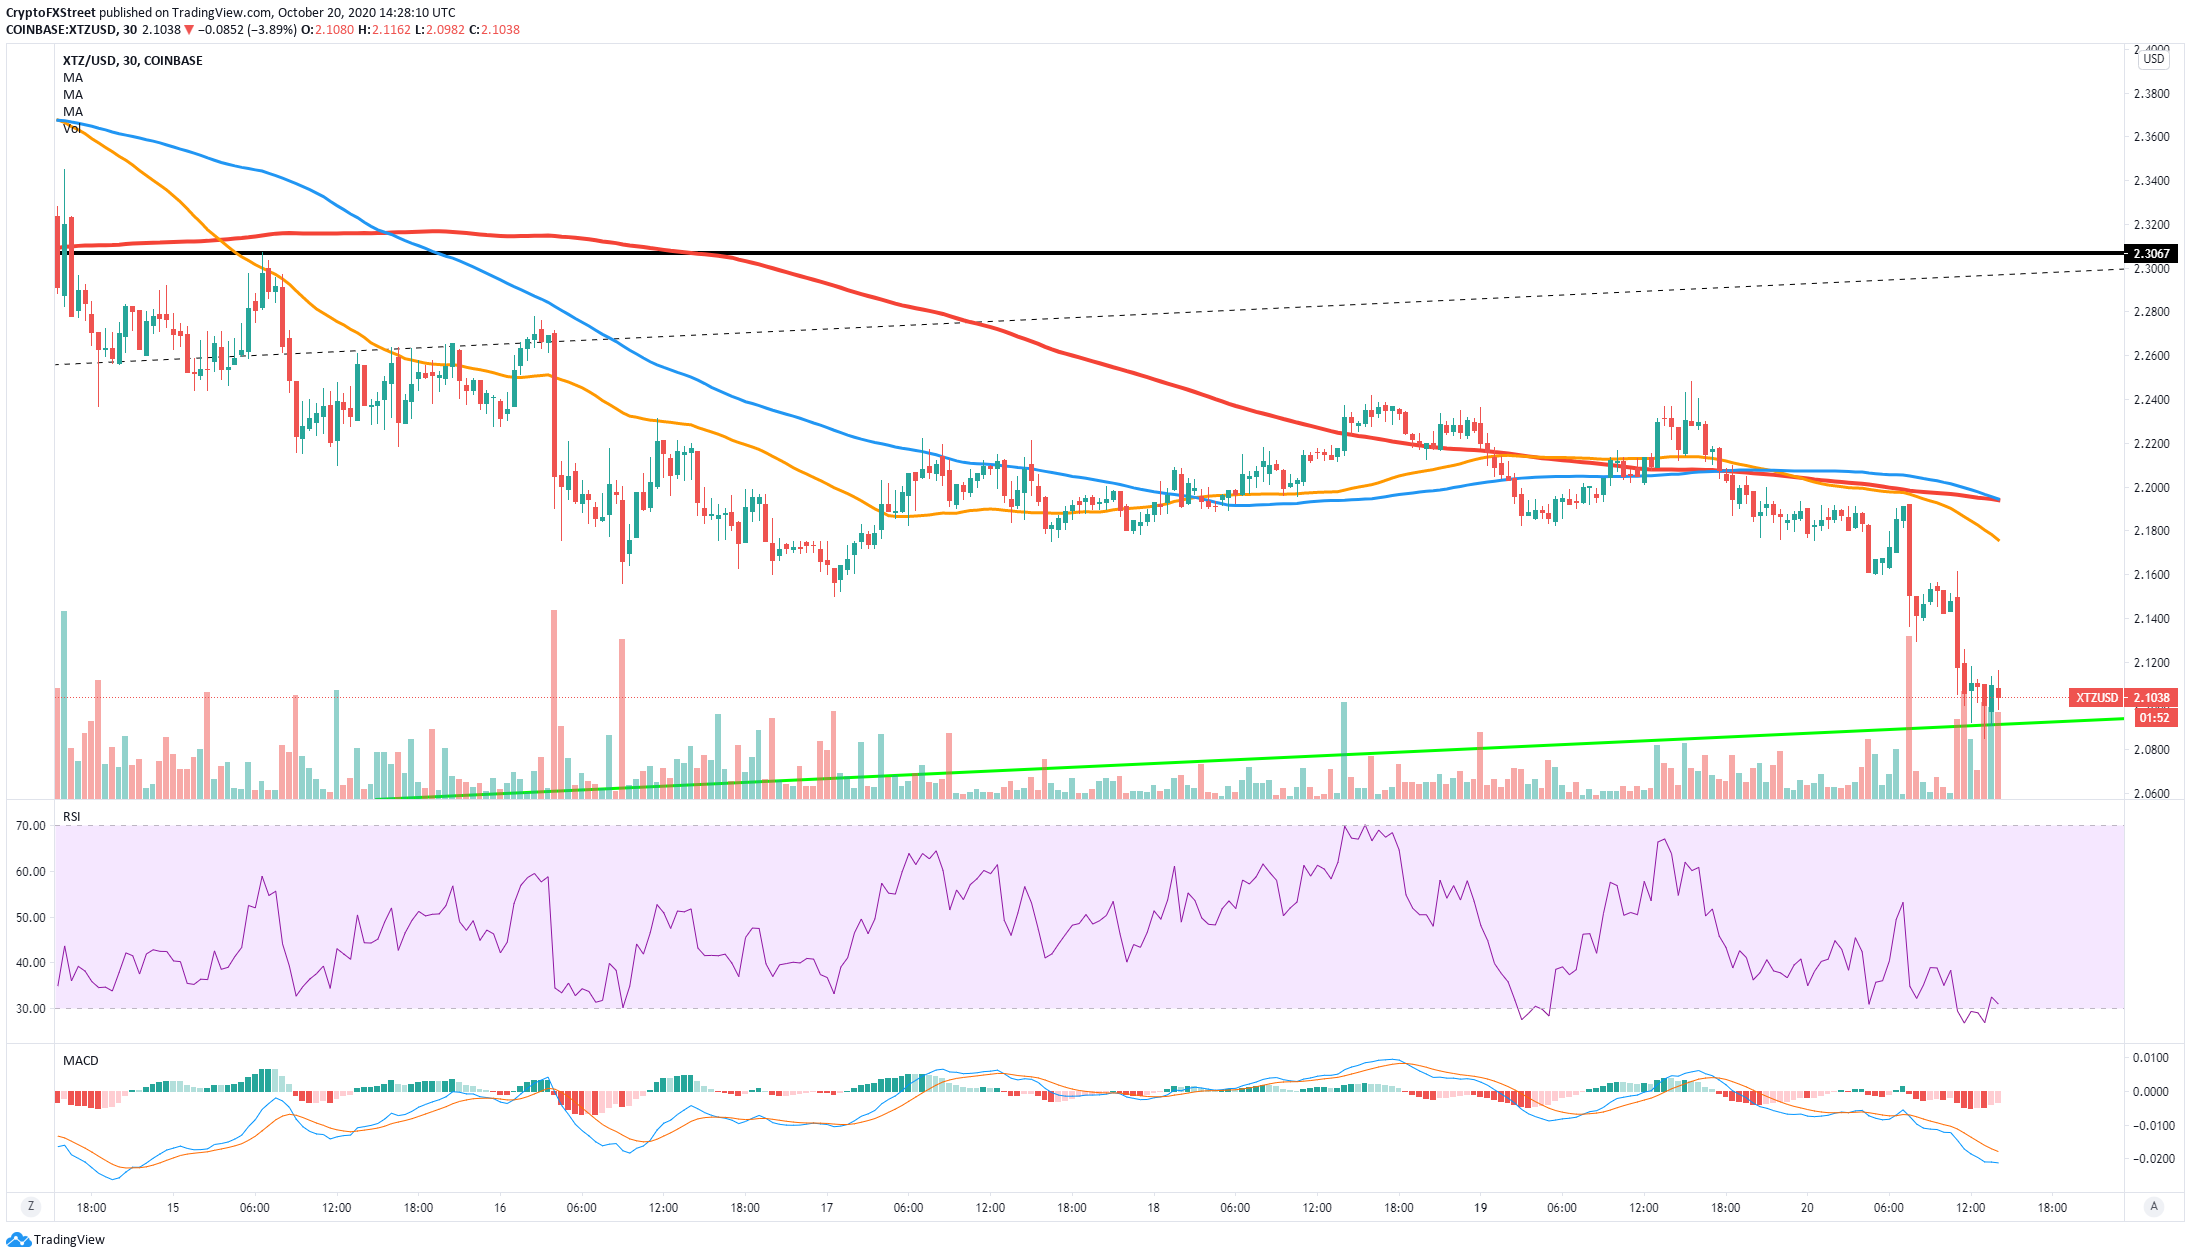
XTZ/USD 30-minutes chart
On the 30-minutes chart, the MACD is slowly turning bullish again while the RSI recovers from oversold levels. Similarly, the next price target would be around $2.2, however, XTZ could easily climb towards $2.3 as bulls will not find a lot of resistance on the way up.
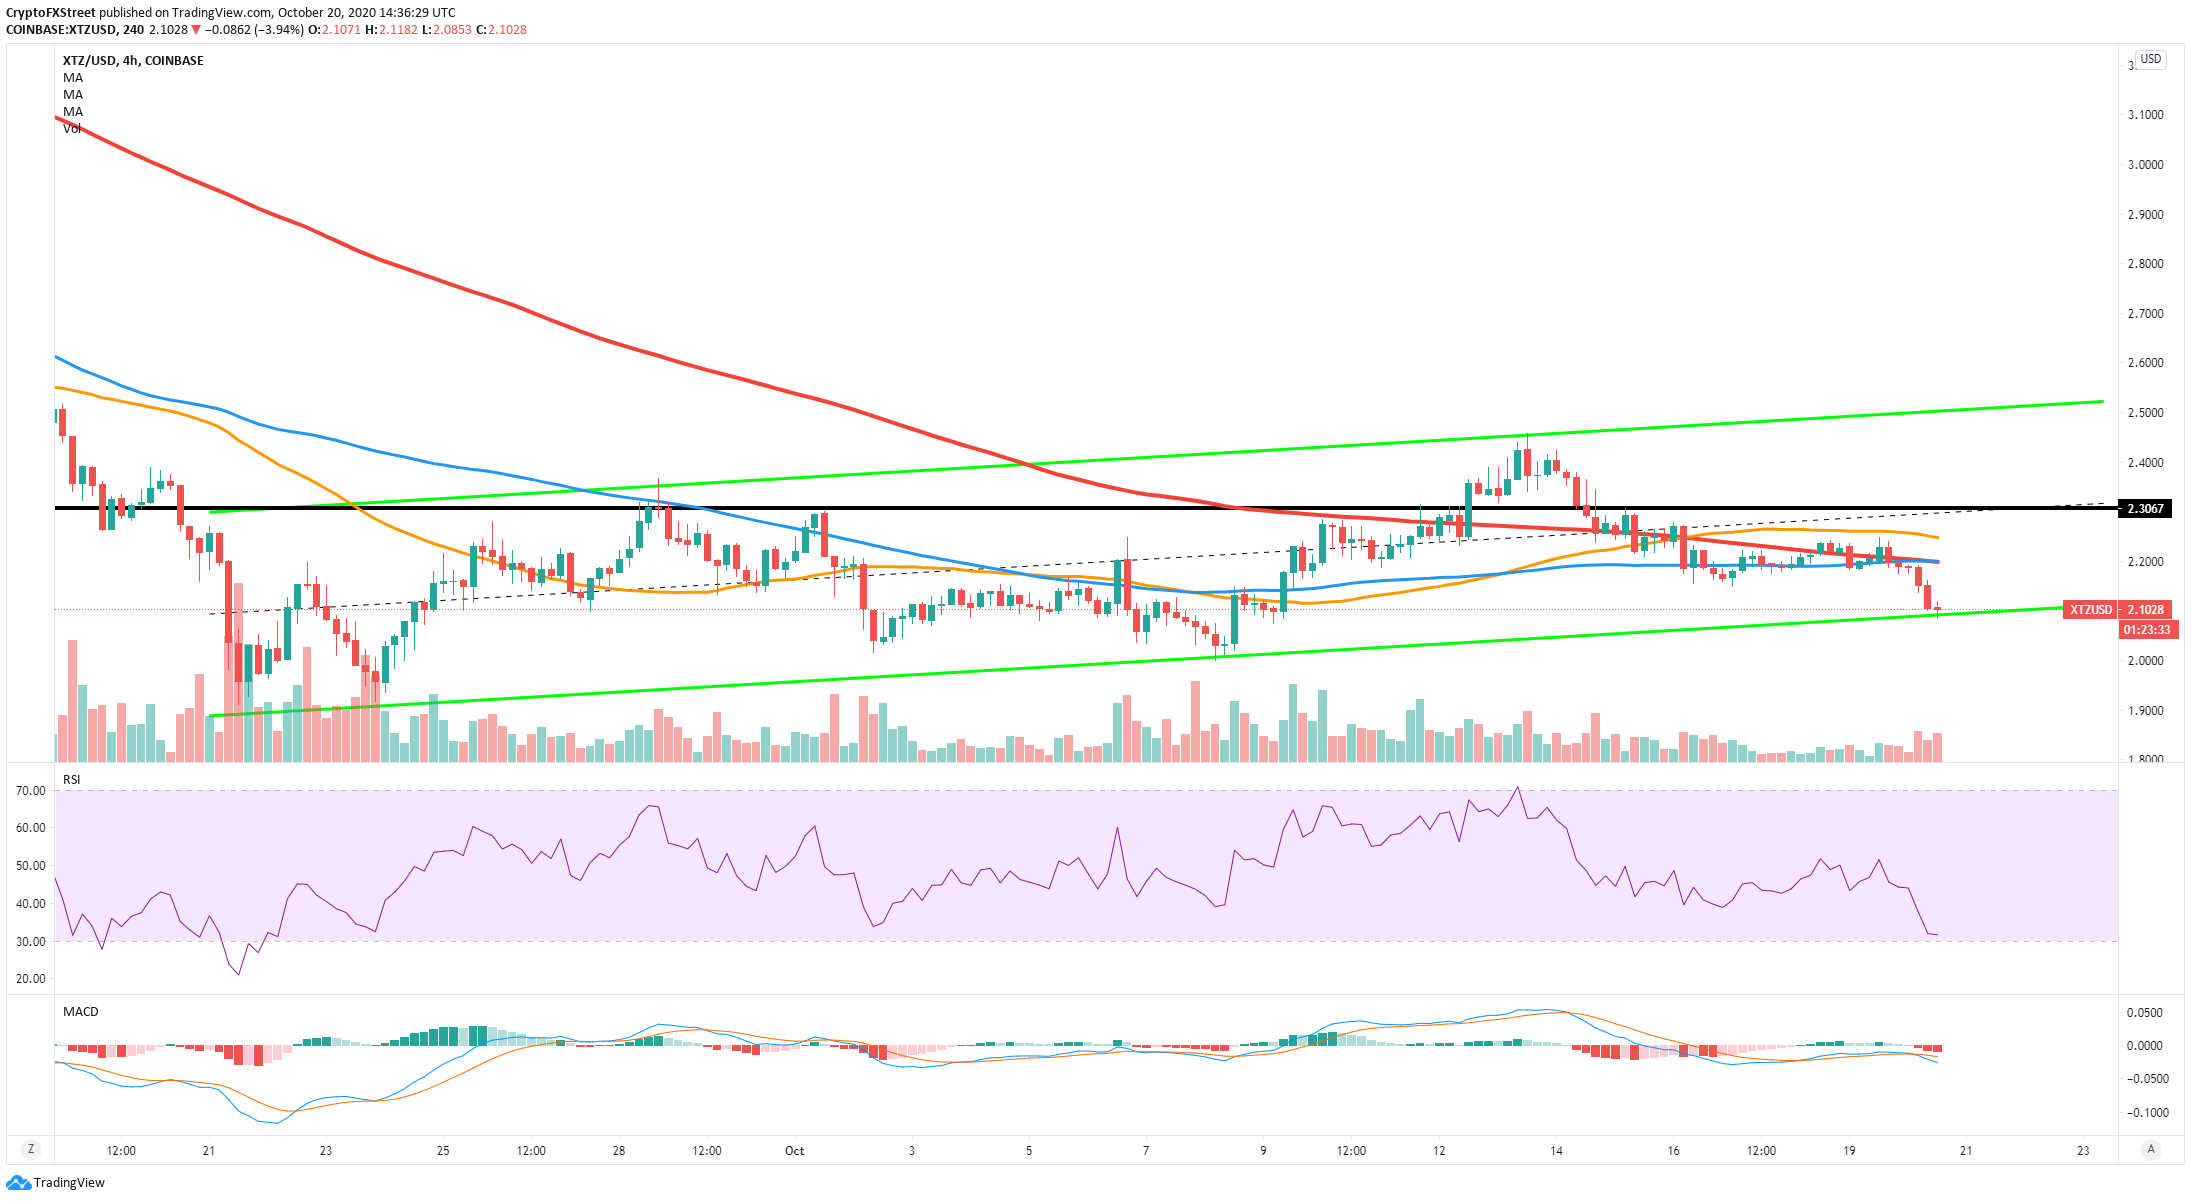
XTZ/USD 4-hour chart
On the other hand, it seems that bears have taken control of the 4-hour chart after the price of XTZ slipped below the 50-SMA, 100-SMA, and even the 200-SMA. On top of that, the MACD just turned bearish for the first time since October 14 and it’s gaining strength.
The RSI is not yet overextended, although it’s close; however, last time, this indicator did present a fakeout while being oversold as the price of Tezos continued falling on September 19. A breakout below the lower boundary of the ascending parallel channel at $2.09 can drive XTZ towards $1.9.
Important price points for investors
The price of XTZ is currently fighting to stay above the lower trendline of an ascending parallel channel. If the bulls can defend this critical support level at $2.09, Tezos can easily jump towards $2.2 and as high as $2.3 in the longer-term.
On the other hand, a bearish breakout below $2.09 would be a notable shift in favor of the sellers. Tezos can slip towards $1.9 and potentially even lower as the digital asset doesn’t have a lot of support on the way down.
Information on these pages contains forward-looking statements that involve risks and uncertainties. Markets and instruments profiled on this page are for informational purposes only and should not in any way come across as a recommendation to buy or sell in these assets. You should do your own thorough research before making any investment decisions. FXStreet does not in any way guarantee that this information is free from mistakes, errors, or material misstatements. It also does not guarantee that this information is of a timely nature. Investing in Open Markets involves a great deal of risk, including the loss of all or a portion of your investment, as well as emotional distress. All risks, losses and costs associated with investing, including total loss of principal, are your responsibility. The views and opinions expressed in this article are those of the authors and do not necessarily reflect the official policy or position of FXStreet nor its advertisers.