Ripple Technical Analysis: XRP/USD gets a breakout above $0.30 but fails to keep the price there
|- XRP/USD was the weakest pair among major cryptocurrencies.
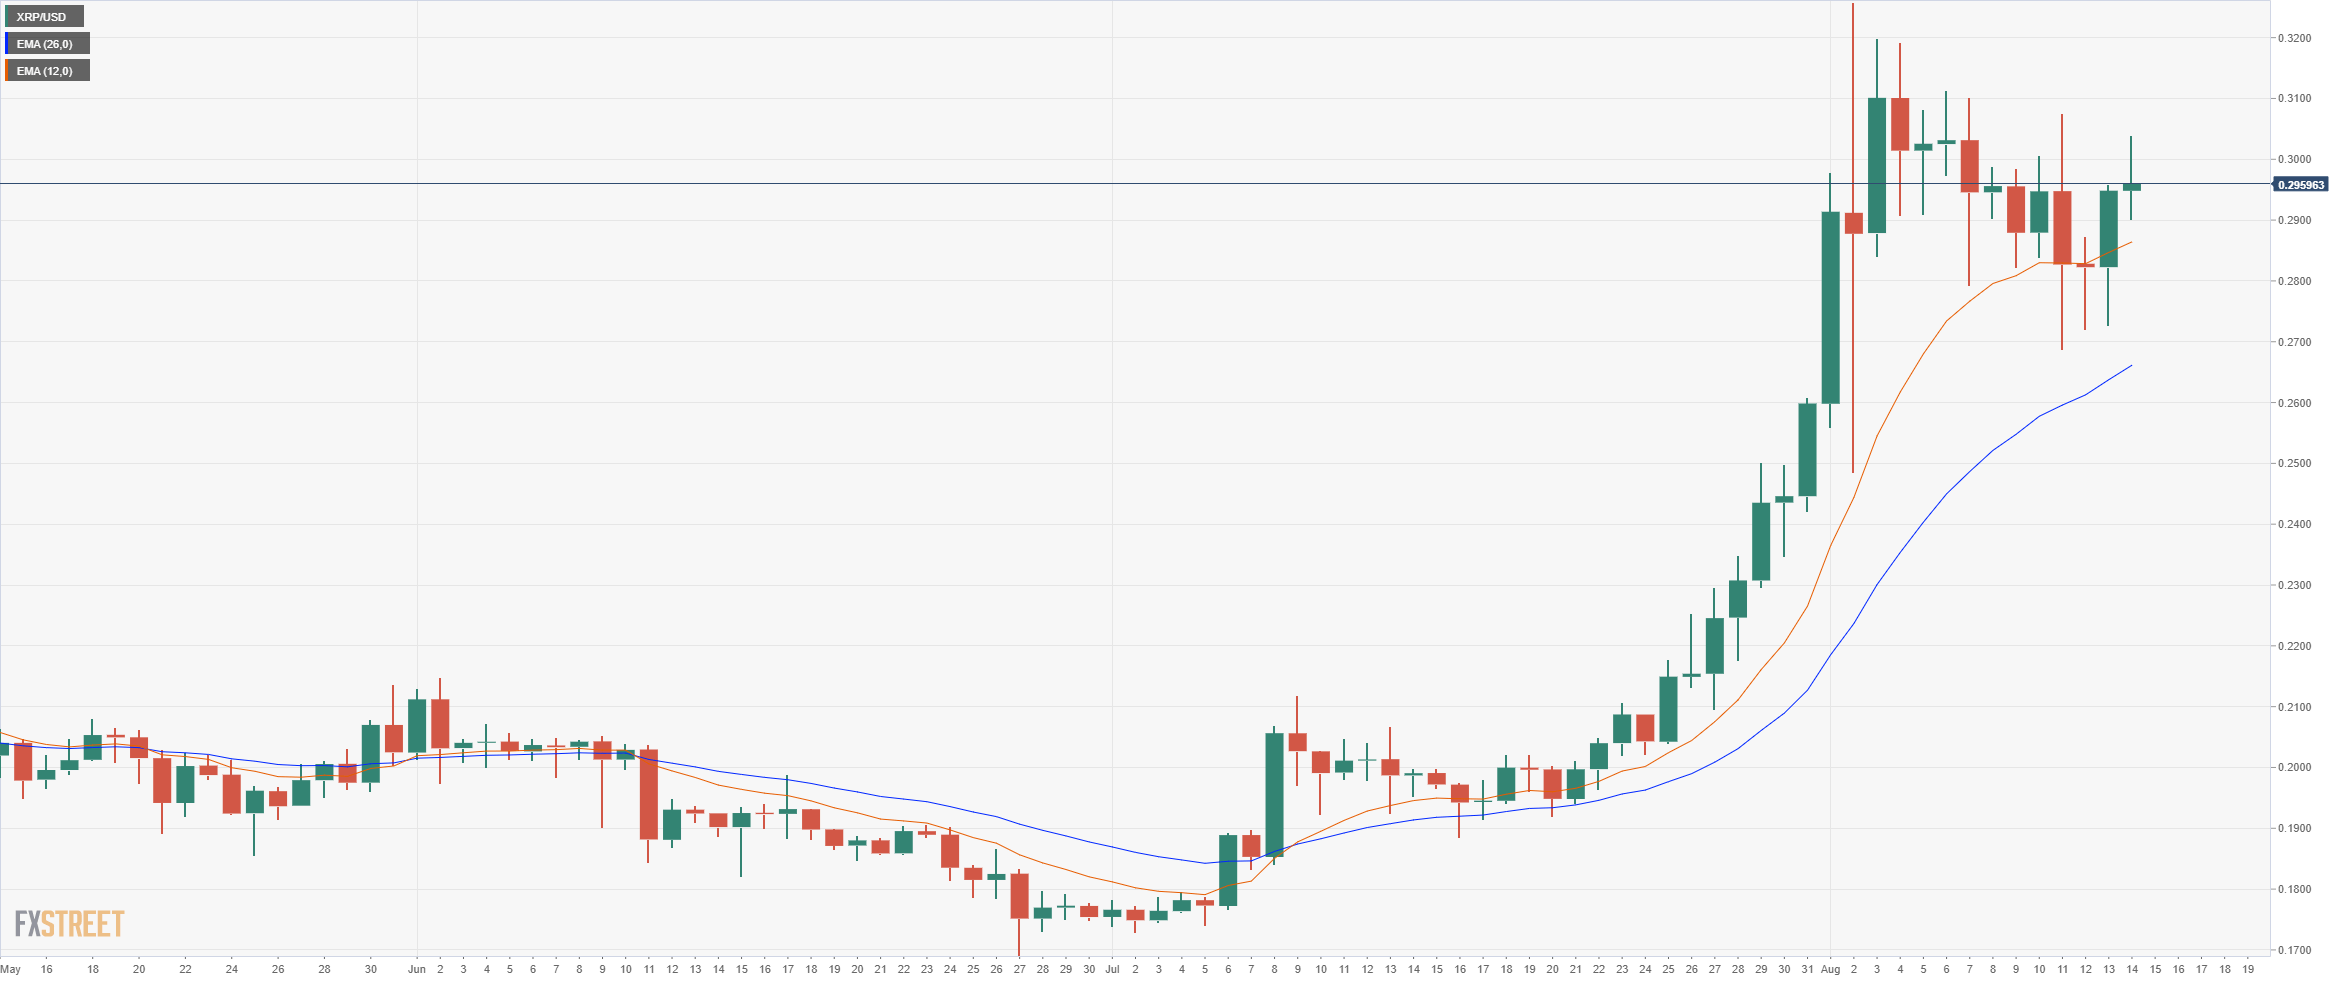
- XRP finally had another breakout above $0.30 but bulls couldn’t sustain the move and XRP is now trading at $0.295.
XRP has been struggling all year in comparison to other major coins. After the initial breakout on July 22, the digital asset was initially outperforming some cryptos, however, the recent consolidation period has been worse than most.
XRP/USD daily chart
The good news for the buyers is that XRP has defended the daily 12-EMA and has bounced from it. The daily uptrend is, of course, still intact but the $0.30 crucial resistance level seems to prevail.
XRP/USD 4-hour chart
-637330170684149032.png)
The 4-hour chart has clearly shifted in favor of the buyers after a bullish cross of the 12-EMA and the 26-EMA.
Information on these pages contains forward-looking statements that involve risks and uncertainties. Markets and instruments profiled on this page are for informational purposes only and should not in any way come across as a recommendation to buy or sell in these assets. You should do your own thorough research before making any investment decisions. FXStreet does not in any way guarantee that this information is free from mistakes, errors, or material misstatements. It also does not guarantee that this information is of a timely nature. Investing in Open Markets involves a great deal of risk, including the loss of all or a portion of your investment, as well as emotional distress. All risks, losses and costs associated with investing, including total loss of principal, are your responsibility. The views and opinions expressed in this article are those of the authors and do not necessarily reflect the official policy or position of FXStreet nor its advertisers.