Ripple Price Prediction: XRP cracks a critical resistance level and targets $0.30
|- XRP is currently trading at $0.263 after breaking a critical resistance level.
- The breakout from the ascending triangle represents a strong bullish indicator.
XRP has been fighting with an ascending triangle pattern for around one month and seems to have finally cracked the upper boundary. If the digital asset can close above this critical resistance point, bulls will be in full control.
XRP finally breaks out and targets $0.30
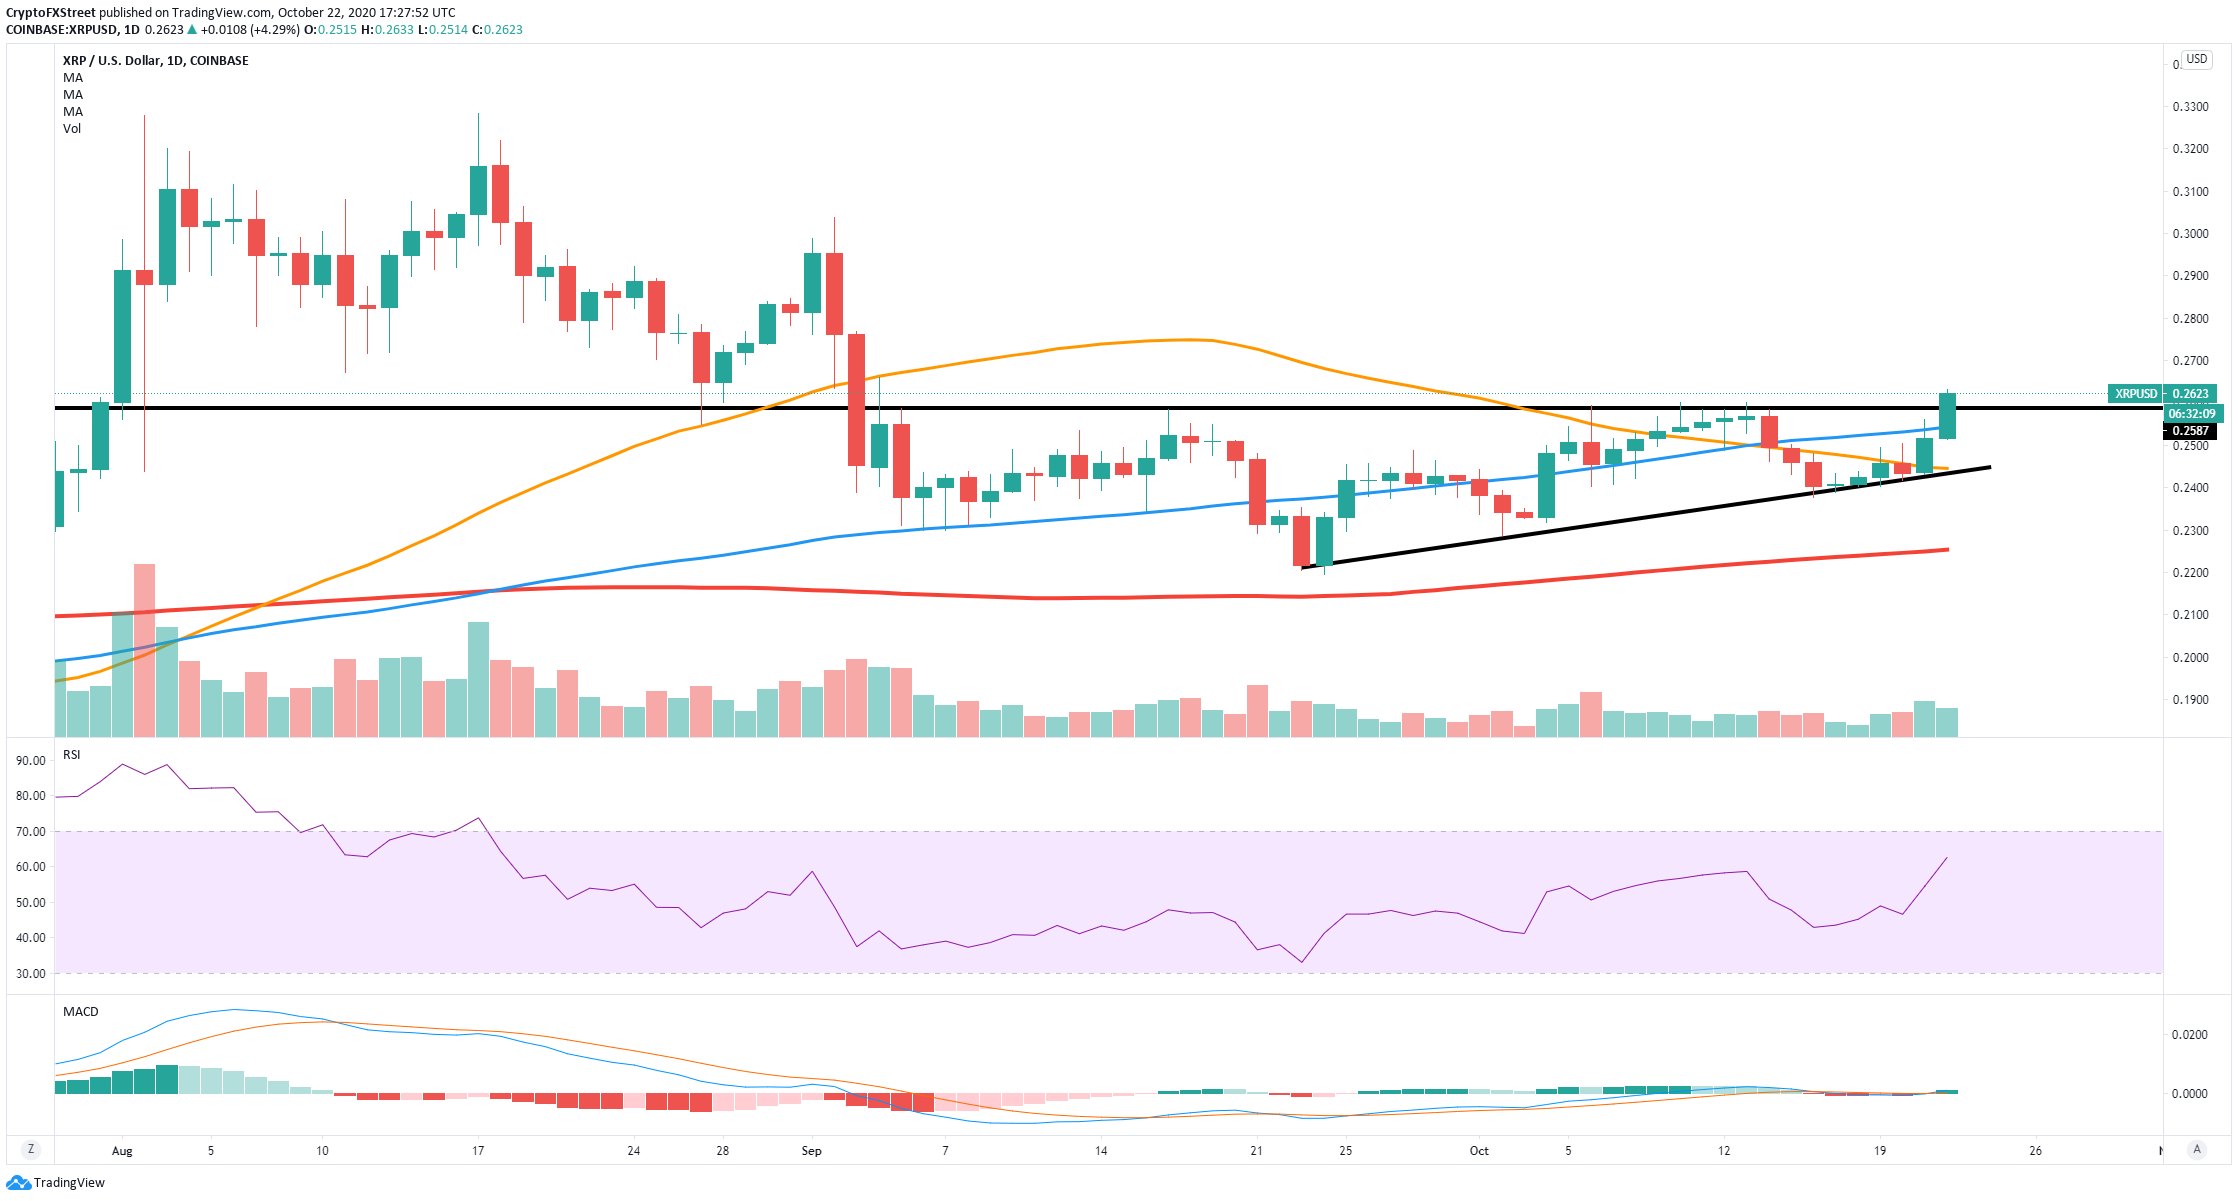
The breakout of the ascending triangle on the daily chart is a notable event. Additionally, the price also managed to climb above the 100-SMA, turning it into a support level. The MACD flipped bullish right after the breakout for the first time since September 26.
XRP/USD daily chart
Surprisingly, the RSI is not overbought just yet, which means bulls are not facing a lot of hurdles to the upside. The next price target seems to be $0.30, a psychological level established on September 1. As long as the 100-SMA remains as a support level, bulls don’t have to worry about anything.
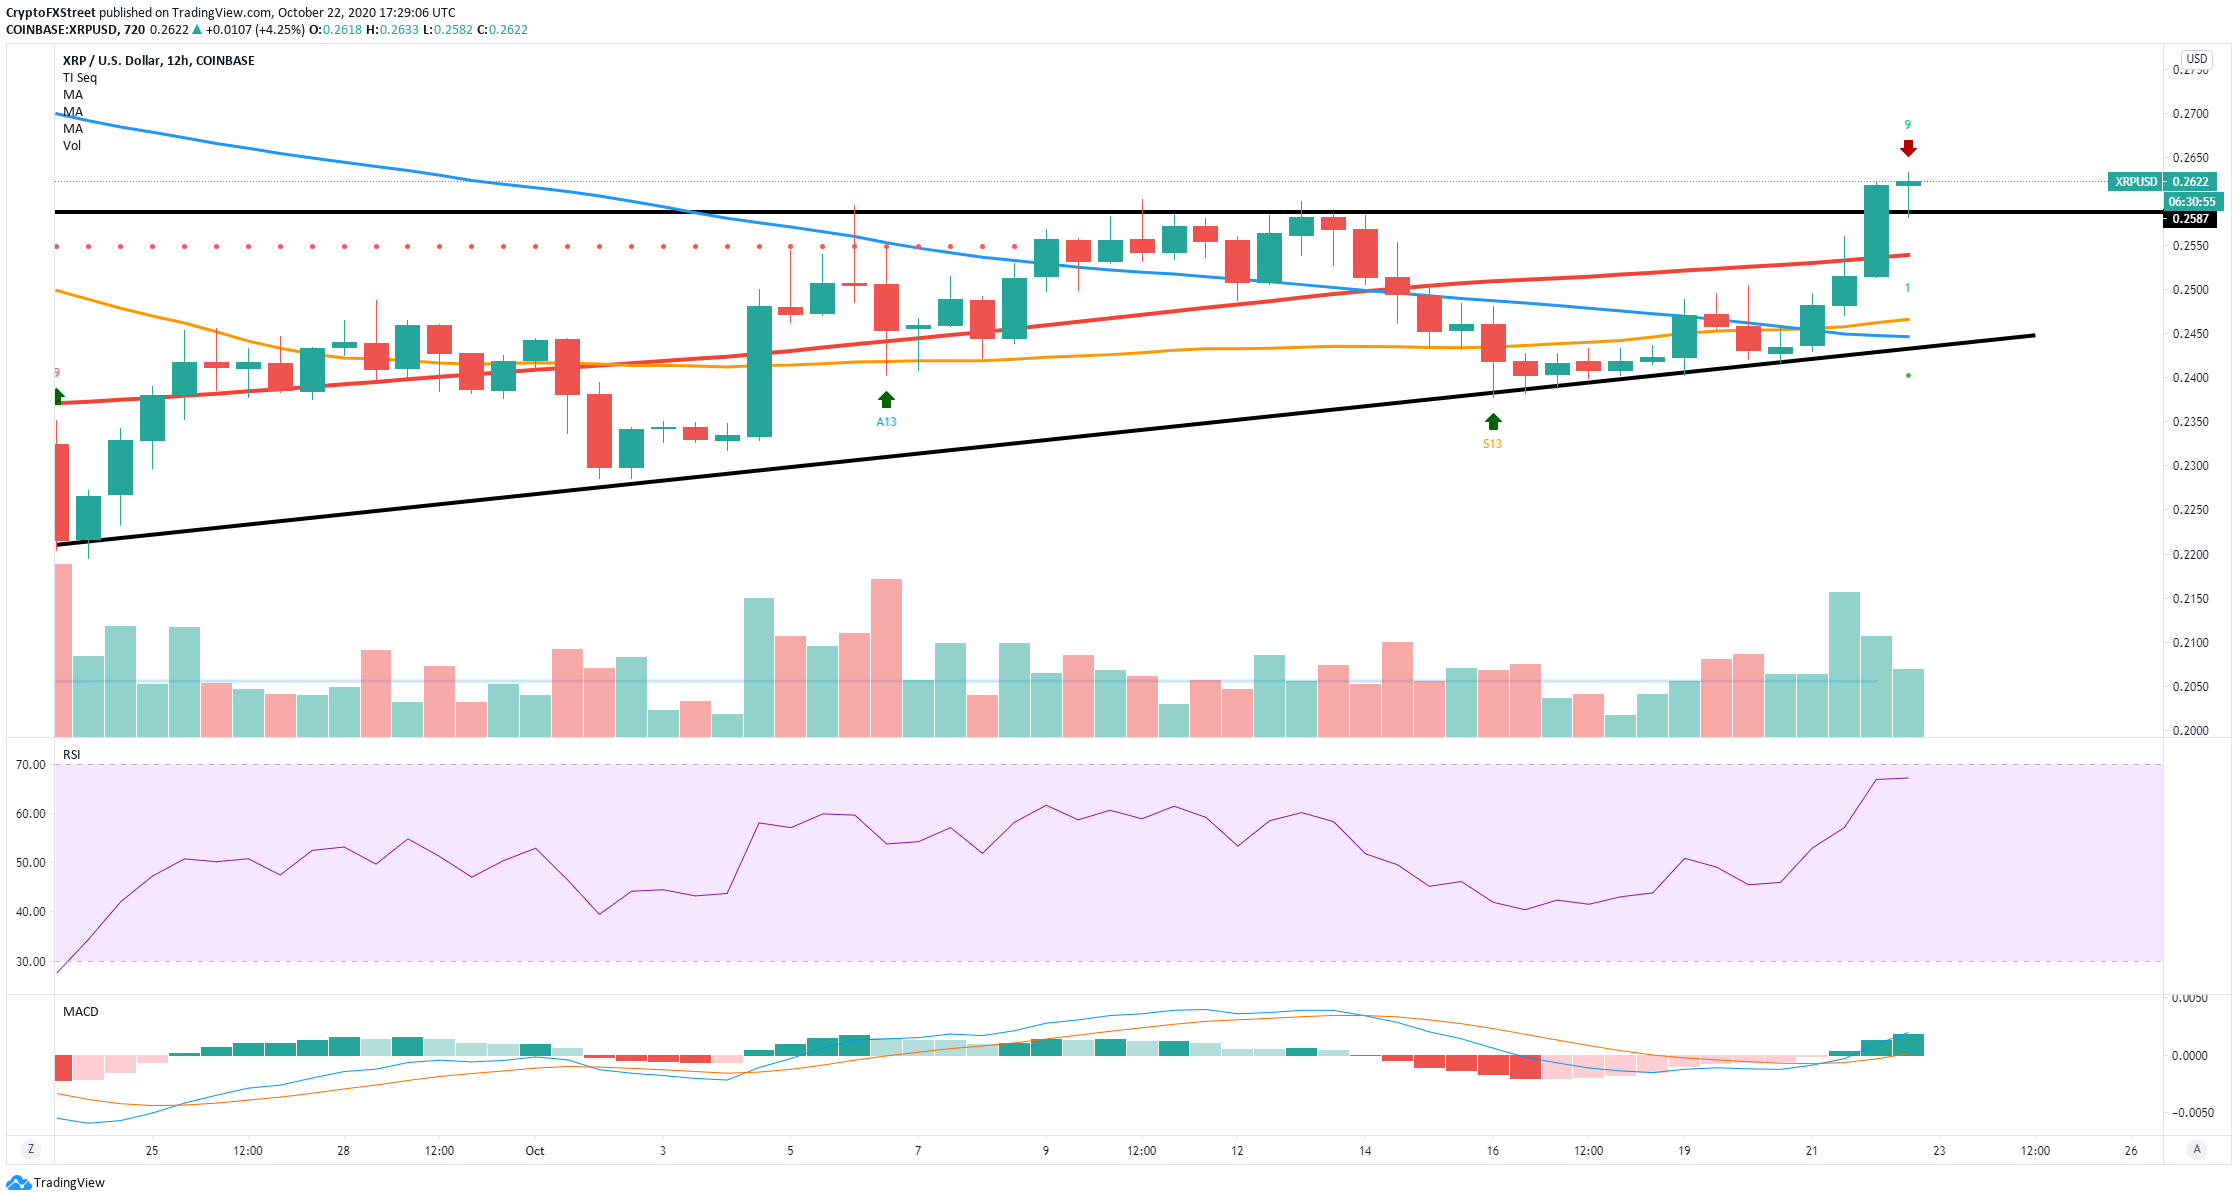
XRP/USD 12-hour chart
However, despite the strong bullish breakout, the TD sequential indicator on the 12-hour chart has presented a sell signal. The RSI is also on the verge of being overextended for the first time since July 30.
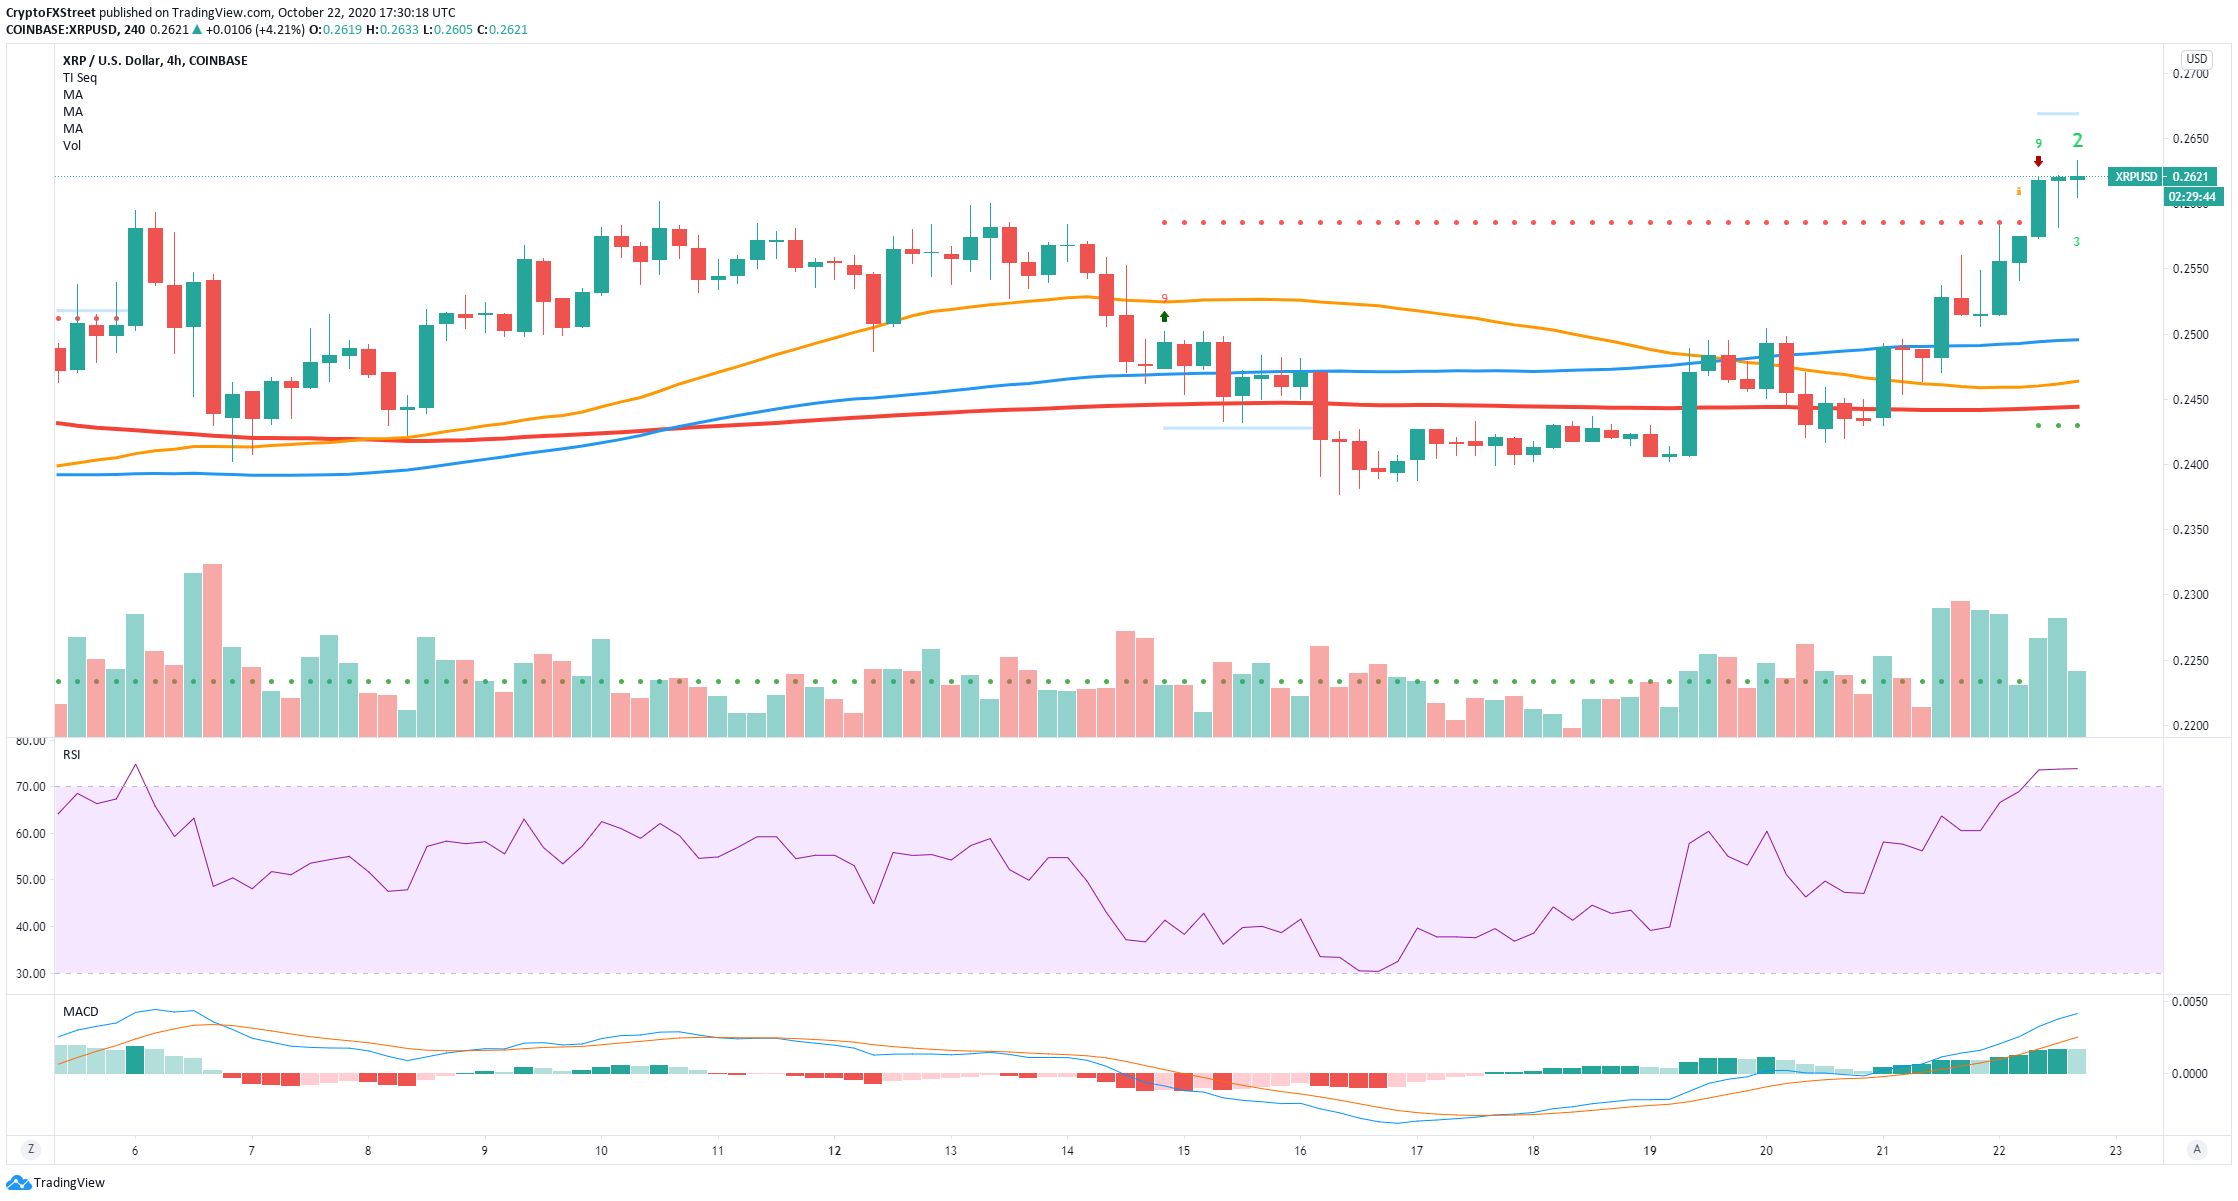
XRP/USD 4-hour chart
Similarly, the TD sequential indicator presented a sell signal on the 4-hour chart where the RSI is overextended. Validation of the sell signal can send XRP down to the first SMA at $0.25 and as low as $0.245 at the 200-SMA.
Interesting price points for XRP
The breakout of the ascending triangle is a major bullish indicator that can potentially drive XRP up to the psychological level of $0.30. Bulls need to hold the 100-SMA support level on the daily chart to avoid the risk of a strong pullback.
On the other side of the fence, bears are keeping an eye on two sell signals presented on the 12-hour chart and 4-hour chart by the TD sequential indicator. Validation of these signals can send the digital asset down to $0.245.
Information on these pages contains forward-looking statements that involve risks and uncertainties. Markets and instruments profiled on this page are for informational purposes only and should not in any way come across as a recommendation to buy or sell in these assets. You should do your own thorough research before making any investment decisions. FXStreet does not in any way guarantee that this information is free from mistakes, errors, or material misstatements. It also does not guarantee that this information is of a timely nature. Investing in Open Markets involves a great deal of risk, including the loss of all or a portion of your investment, as well as emotional distress. All risks, losses and costs associated with investing, including total loss of principal, are your responsibility. The views and opinions expressed in this article are those of the authors and do not necessarily reflect the official policy or position of FXStreet nor its advertisers.