LTC/USD technical analysis: Litecoin is looking for support levels
|- All the major cryptocurrencies are trading in the red today and Litecoin is 1.71% lower.
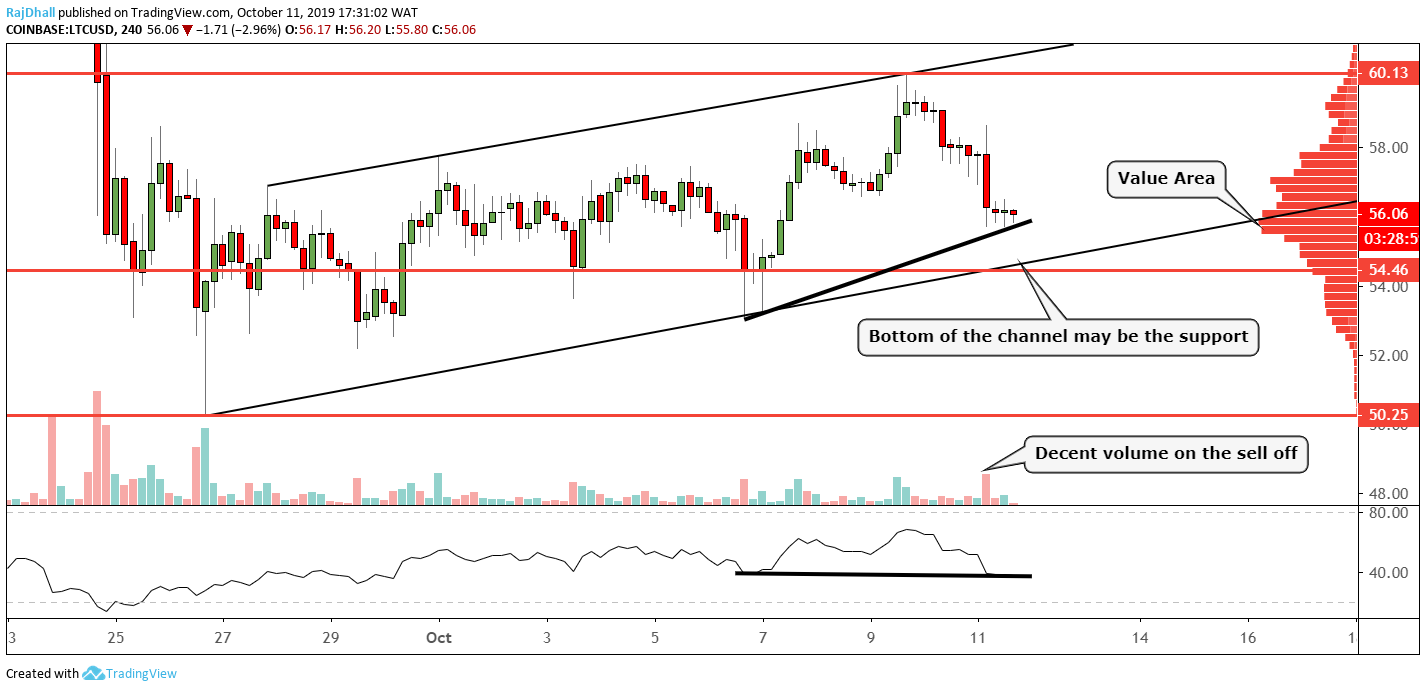
- The RSI is giving a bullish signal but it still needs to be confirmed.
LTC/USD has found some support at the value area on the volume profile indicator on the right-hand side of the chart.
This represents the area where most volume has been traded and in this case, it is at 55.80.
The relative strength index (RSI) indicator is showing a bullish failure swing. This is when the indicator makes a wave low but the price makes a higher low.
There has been decent volume on the sell-off but we need to see what happens when the Asian traders come to market.
The psychological 60 level on the upside is the target for the bulls and this is where price stalled on the last bullish run.
Information on these pages contains forward-looking statements that involve risks and uncertainties. Markets and instruments profiled on this page are for informational purposes only and should not in any way come across as a recommendation to buy or sell in these assets. You should do your own thorough research before making any investment decisions. FXStreet does not in any way guarantee that this information is free from mistakes, errors, or material misstatements. It also does not guarantee that this information is of a timely nature. Investing in Open Markets involves a great deal of risk, including the loss of all or a portion of your investment, as well as emotional distress. All risks, losses and costs associated with investing, including total loss of principal, are your responsibility. The views and opinions expressed in this article are those of the authors and do not necessarily reflect the official policy or position of FXStreet nor its advertisers.