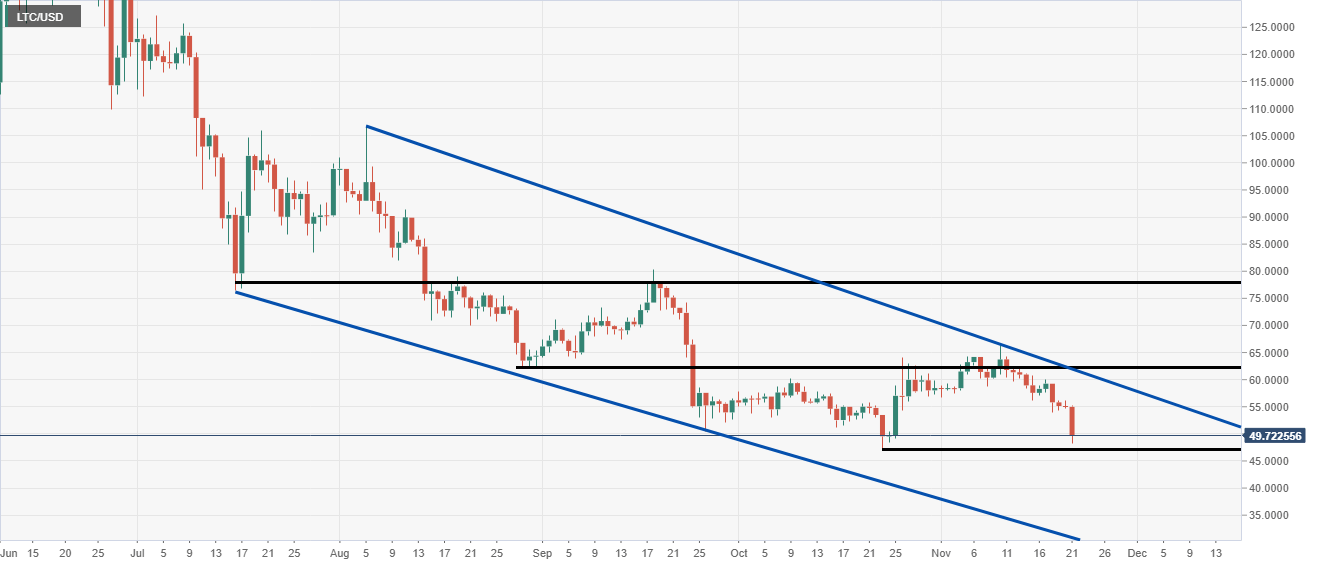
LTC/USD Technical Analysis: 50.00 has broken to the downside
|- Like all the crypto majors Litecoin has also suffered today falling 9.29%.
- There is a support level on the horizon but the psychological 50.00 level has been broken.
LTC/USD Daily Chart
LTC/USD is still looking bearish after the psychological 50.00 level broke.
It is one of the worst-performing crypto's today after the heavy fall earlier in the session
Now 47.22 is in focus as it is the previous wave low, but the selling momentum has slowed down.
There is a channel formation marked in blue to keep an eye on too.
Every time a previous wave low breaks the price moves a leg lower.
Additional Levels
Information on these pages contains forward-looking statements that involve risks and uncertainties. Markets and instruments profiled on this page are for informational purposes only and should not in any way come across as a recommendation to buy or sell in these assets. You should do your own thorough research before making any investment decisions. FXStreet does not in any way guarantee that this information is free from mistakes, errors, or material misstatements. It also does not guarantee that this information is of a timely nature. Investing in Open Markets involves a great deal of risk, including the loss of all or a portion of your investment, as well as emotional distress. All risks, losses and costs associated with investing, including total loss of principal, are your responsibility. The views and opinions expressed in this article are those of the authors and do not necessarily reflect the official policy or position of FXStreet nor its advertisers.