Ethereum Technical Analysis: Ethereum still on its way to crack $400
|- ETH/USD is currently trading at $392 and eying up the $400 resistance level.
- The daily chart is still a bull flag awaiting confirmation from the buyers.
Ethereum price is currently hovering $392 as bulls are getting ready for the next leg up. The trading volume has been decreasing in the past few days and many indicators have been able to cool off.
ETH/USD daily chart
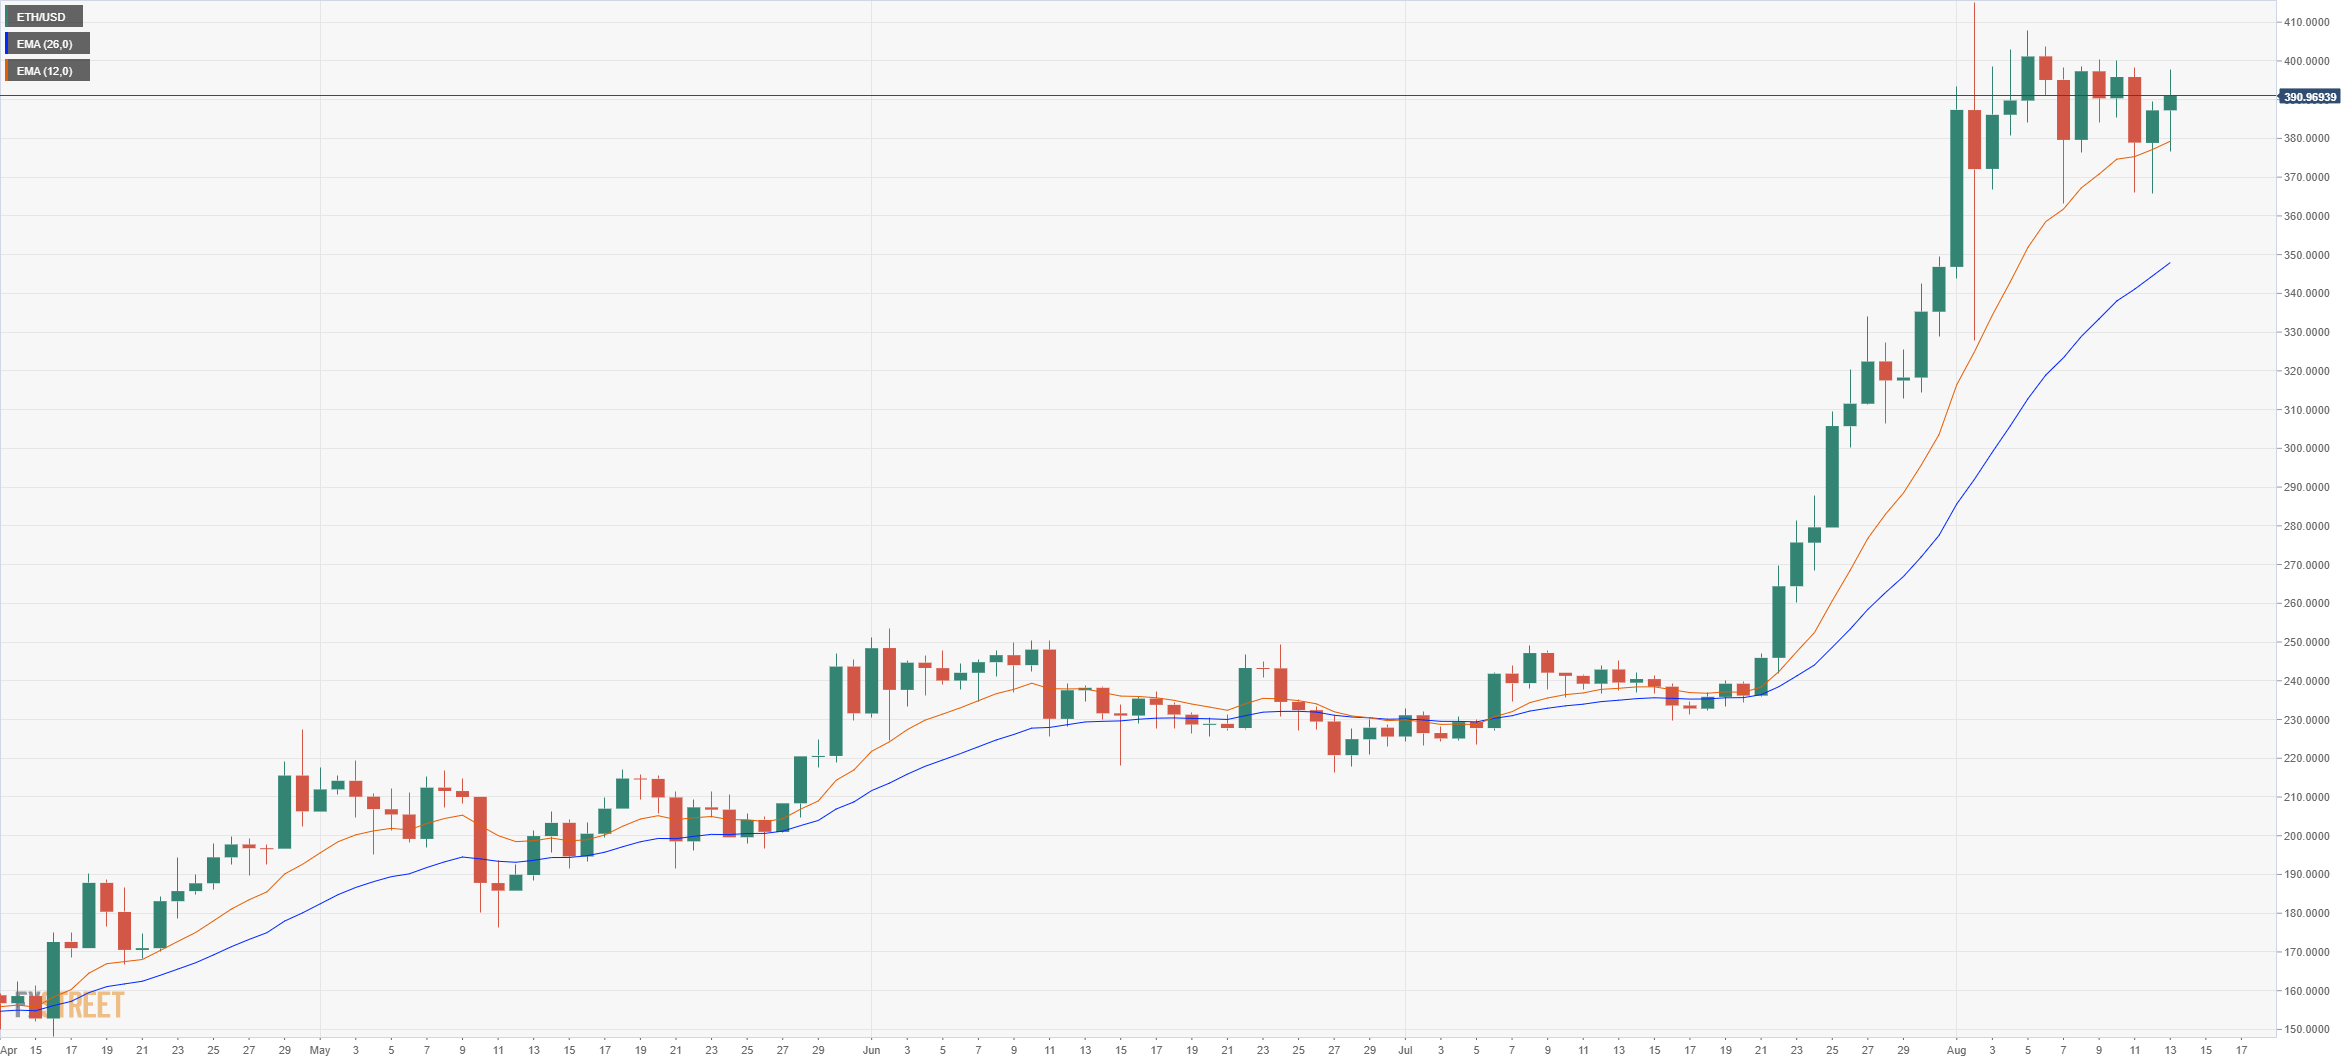
The daily chart is still a bull flag awaiting another leg up while the RSI has cooled off notably. The 12-EMA has been a strong support level for Ethereum which has bounced several times from it.
ETH/USD 4-hour chart
-637329366227850329.png)
Ethereum is clearly trading sideways and has lost the EMA’s a few times but it’s now trading above both again. The only real resistance level is located at $400, a breakout above this level will take Ethereum towards $415 and most likely close to $450 thanks to the bullish momentum.
Information on these pages contains forward-looking statements that involve risks and uncertainties. Markets and instruments profiled on this page are for informational purposes only and should not in any way come across as a recommendation to buy or sell in these assets. You should do your own thorough research before making any investment decisions. FXStreet does not in any way guarantee that this information is free from mistakes, errors, or material misstatements. It also does not guarantee that this information is of a timely nature. Investing in Open Markets involves a great deal of risk, including the loss of all or a portion of your investment, as well as emotional distress. All risks, losses and costs associated with investing, including total loss of principal, are your responsibility. The views and opinions expressed in this article are those of the authors and do not necessarily reflect the official policy or position of FXStreet nor its advertisers.