EOS/USD technical analysis: EOS could find support here
|- EOS is trading -1.59% lower today as cryptocurrency sentiment is mixed.
- On the four hour chart there is a bullish signal that could indicate a move higher.
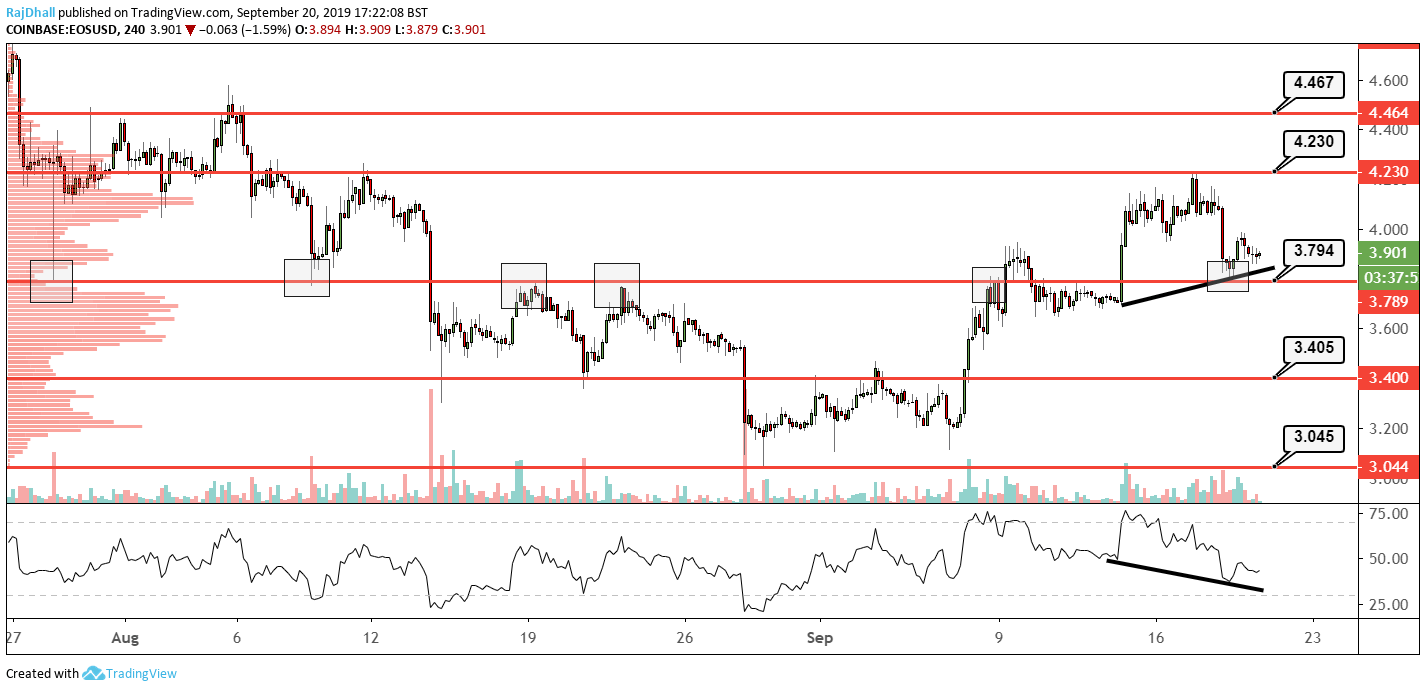
On the four-hour EOS/USD chart there is an indication that we may have come to a support zone.
3.794 has been used as support and resistance (marked by the squares on the chart) on six occasions now.
This time after the price dipped below 4.000 again we need to see if the support holds.
On the RSI indicator, there is a bullish failure swing signal that might point to a move higher.
After the psychological 4.000 resistance, the next level up is 4.230.
Volume at the moment is very average but most of the volume spikes have supported the bid.
Lastly, on the volume profile indicator there is a low volume node (LVN) which can be a good sign that the support will hold.
Information on these pages contains forward-looking statements that involve risks and uncertainties. Markets and instruments profiled on this page are for informational purposes only and should not in any way come across as a recommendation to buy or sell in these assets. You should do your own thorough research before making any investment decisions. FXStreet does not in any way guarantee that this information is free from mistakes, errors, or material misstatements. It also does not guarantee that this information is of a timely nature. Investing in Open Markets involves a great deal of risk, including the loss of all or a portion of your investment, as well as emotional distress. All risks, losses and costs associated with investing, including total loss of principal, are your responsibility. The views and opinions expressed in this article are those of the authors and do not necessarily reflect the official policy or position of FXStreet nor its advertisers.