BTC/USD technical analysis: There is another technical formation on the hourly chart
|- BTC/USD is down another 2.83% today after the major fall two sessions ago.
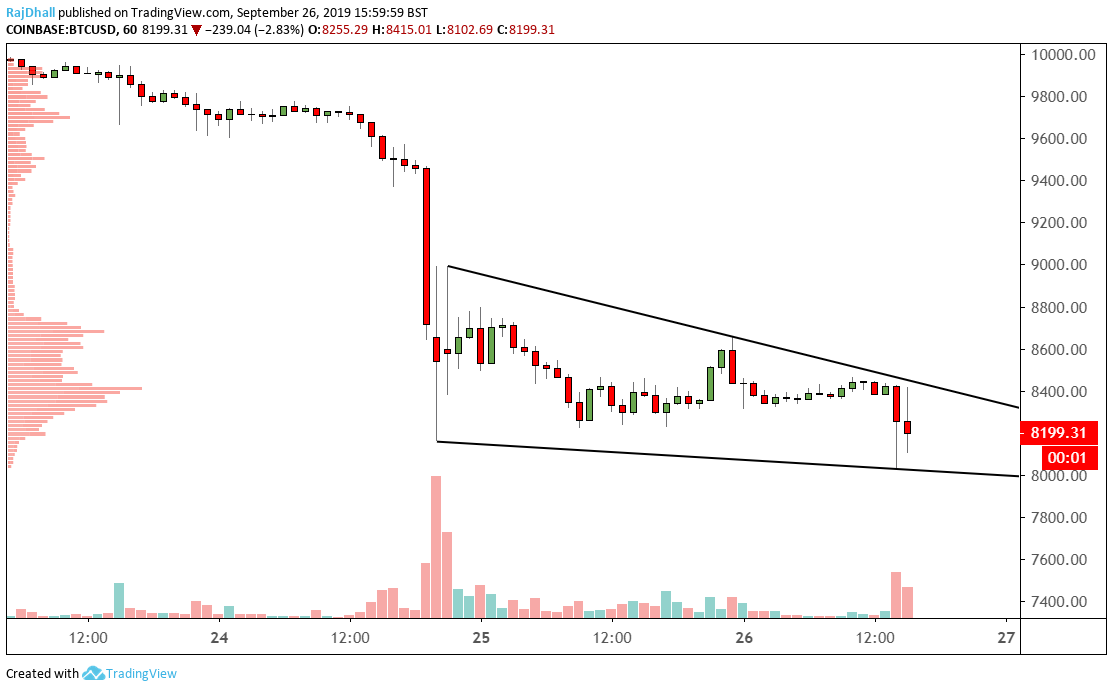
- Now there is a falling wedge pattern on the hourly chart that could indicate which way price may turn.
The market found support at 8k today as the bearishness continued.
After the fall two sessions ago the price has now consolidated into a falling wedge formation.
Mean value is around 8,400 so if we see another rejection keep an eye on price action there.
Bulls are hoping for a break of the pattern high at 8,800 to signal a move higher.
Information on these pages contains forward-looking statements that involve risks and uncertainties. Markets and instruments profiled on this page are for informational purposes only and should not in any way come across as a recommendation to buy or sell in these assets. You should do your own thorough research before making any investment decisions. FXStreet does not in any way guarantee that this information is free from mistakes, errors, or material misstatements. It also does not guarantee that this information is of a timely nature. Investing in Open Markets involves a great deal of risk, including the loss of all or a portion of your investment, as well as emotional distress. All risks, losses and costs associated with investing, including total loss of principal, are your responsibility. The views and opinions expressed in this article are those of the authors and do not necessarily reflect the official policy or position of FXStreet nor its advertisers.