BTC/USD technical analysis: Nice price pattern breakout could lead to higher levels
|- Bitcoin sentiment is better today as BTC/USD trades 1.44% today.
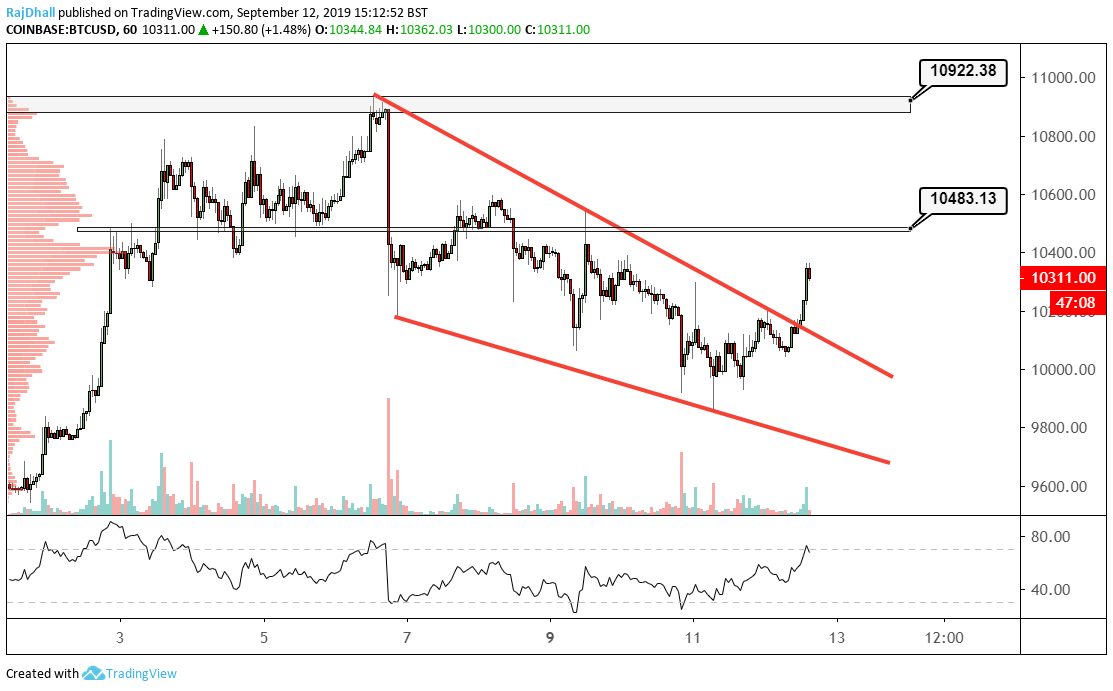
- The decending wedge formation broke to the upside today.
On the intraday timeframe, there was a nice pattern breakout in the BTC/USD pair.
There was a descending wedge formation in the price action yesterday as 10k was defended yet again.
Price is now headed to the value area on the chart pointed out by the volume profile indicator on the left.
The peak of the bell curve represents the price were most contracts have been traded.
Currently, the price is USD 100 away from that level but is looking positive and could reach there this evening.
The RSI indicator has hit the overbought level and could be due a small retracement but this does not mean the buying is over.
The next resistance level on the way up is at 10,483.13 and we could see some hesitation there.
Information on these pages contains forward-looking statements that involve risks and uncertainties. Markets and instruments profiled on this page are for informational purposes only and should not in any way come across as a recommendation to buy or sell in these assets. You should do your own thorough research before making any investment decisions. FXStreet does not in any way guarantee that this information is free from mistakes, errors, or material misstatements. It also does not guarantee that this information is of a timely nature. Investing in Open Markets involves a great deal of risk, including the loss of all or a portion of your investment, as well as emotional distress. All risks, losses and costs associated with investing, including total loss of principal, are your responsibility. The views and opinions expressed in this article are those of the authors and do not necessarily reflect the official policy or position of FXStreet nor its advertisers.