BTC/USD technical analysis: Bitcoin needs to break out of this range
|- Bitcoin is struggling to break out of the rance between 10,953.00 and 9,319.10.
- There is the potential of an upside breakout but the 10,365.20 resistance is first.
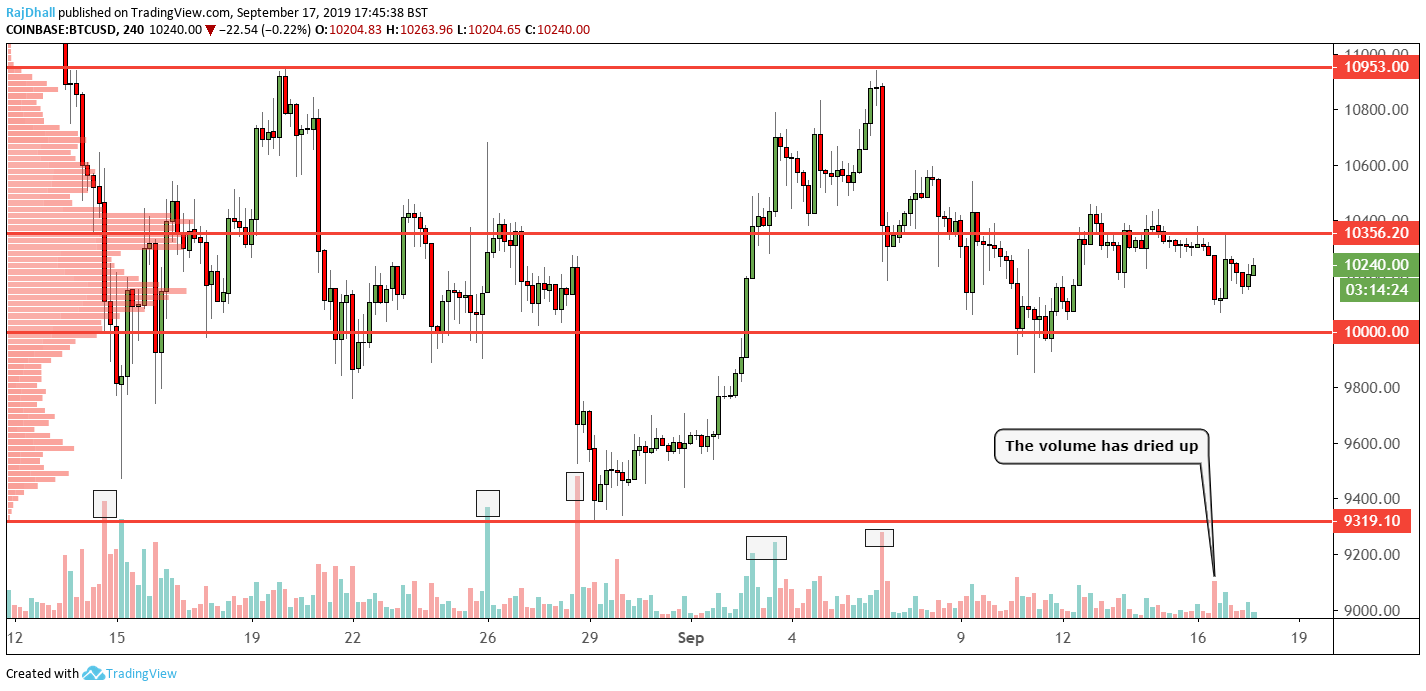
On the four hour chart below, the BTC/USD price is showing that it is stuck between some tight ranges.
This is obviously pretty peculiar for Bitcoin which is usually volatile. Even worse over the past few days, we have been stuck in a USD 458 range.
The main value area point on the volume profile indicator is at 10,365.20. If price breaks higher and holds above there it would be a great indication that we could move to the top side of the range.
On the lower part of the chart, I have highlighted the main areas were volume as kicked in. There has been a big dry up in volumes since the last spike on September 16th and if we look closely the higher spikes have been on the sell-side.
Information on these pages contains forward-looking statements that involve risks and uncertainties. Markets and instruments profiled on this page are for informational purposes only and should not in any way come across as a recommendation to buy or sell in these assets. You should do your own thorough research before making any investment decisions. FXStreet does not in any way guarantee that this information is free from mistakes, errors, or material misstatements. It also does not guarantee that this information is of a timely nature. Investing in Open Markets involves a great deal of risk, including the loss of all or a portion of your investment, as well as emotional distress. All risks, losses and costs associated with investing, including total loss of principal, are your responsibility. The views and opinions expressed in this article are those of the authors and do not necessarily reflect the official policy or position of FXStreet nor its advertisers.