BTC/USD technical analysis: Bitcoin has started to sell off and price is heading to 8k
|- BTC/USD is trading 3.30% lower today as sentiment weakens across the board.
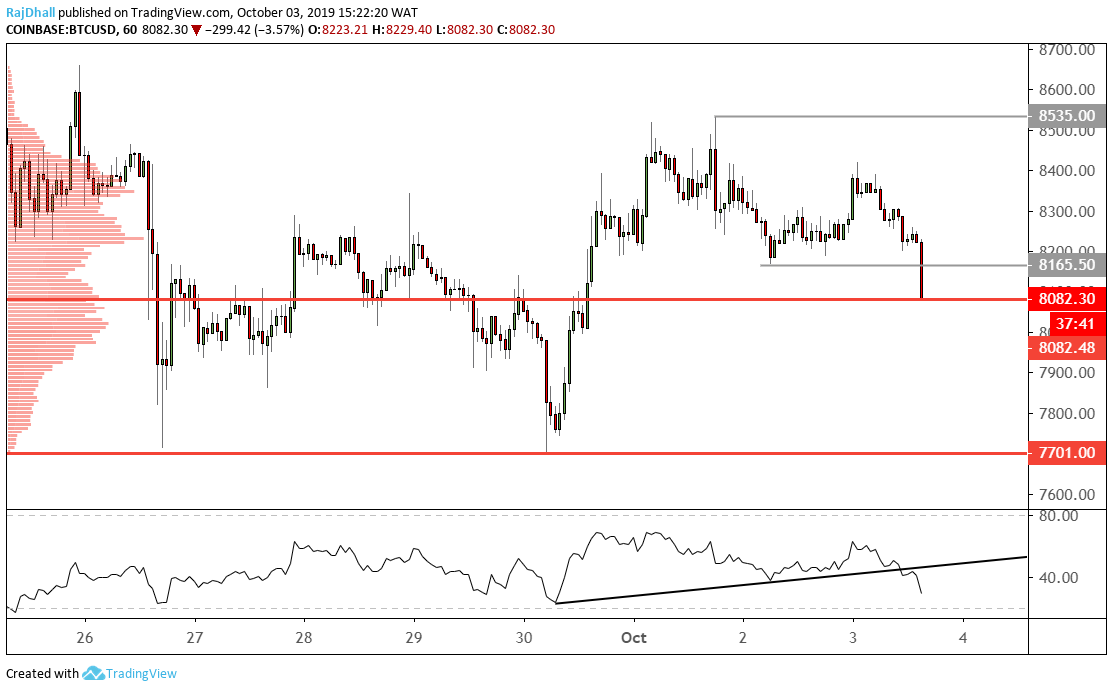
- The BTC/USD price is heading toward some key support levels.
On the hourly chart below it seems that price is heading toward the support levels below price.
8,082.48 has been used a few times and seems to be acting like a pivot zone.
The relative strength index (RSI) has shown a bearish sign after the trednline broke to the downside.
Below the 8,082.48 zone the psychological 8k level lies in wait and beyond that 7,700.00 could be the next support area.
The price action seems to be bearish as one lower high and two lower lows have been created but as the US traders come to market lets see if the bearishness can continue.
Information on these pages contains forward-looking statements that involve risks and uncertainties. Markets and instruments profiled on this page are for informational purposes only and should not in any way come across as a recommendation to buy or sell in these assets. You should do your own thorough research before making any investment decisions. FXStreet does not in any way guarantee that this information is free from mistakes, errors, or material misstatements. It also does not guarantee that this information is of a timely nature. Investing in Open Markets involves a great deal of risk, including the loss of all or a portion of your investment, as well as emotional distress. All risks, losses and costs associated with investing, including total loss of principal, are your responsibility. The views and opinions expressed in this article are those of the authors and do not necessarily reflect the official policy or position of FXStreet nor its advertisers.