Binance Coin Technical Analysis: BNB/USD eying up $27 after another breakout to $23.54
|- BNB/USD is up 4% in the last 24 hours and facing very little resistance to the upside.
- The 100-EMA and the 200-EMA crossed bullishly on August 1.
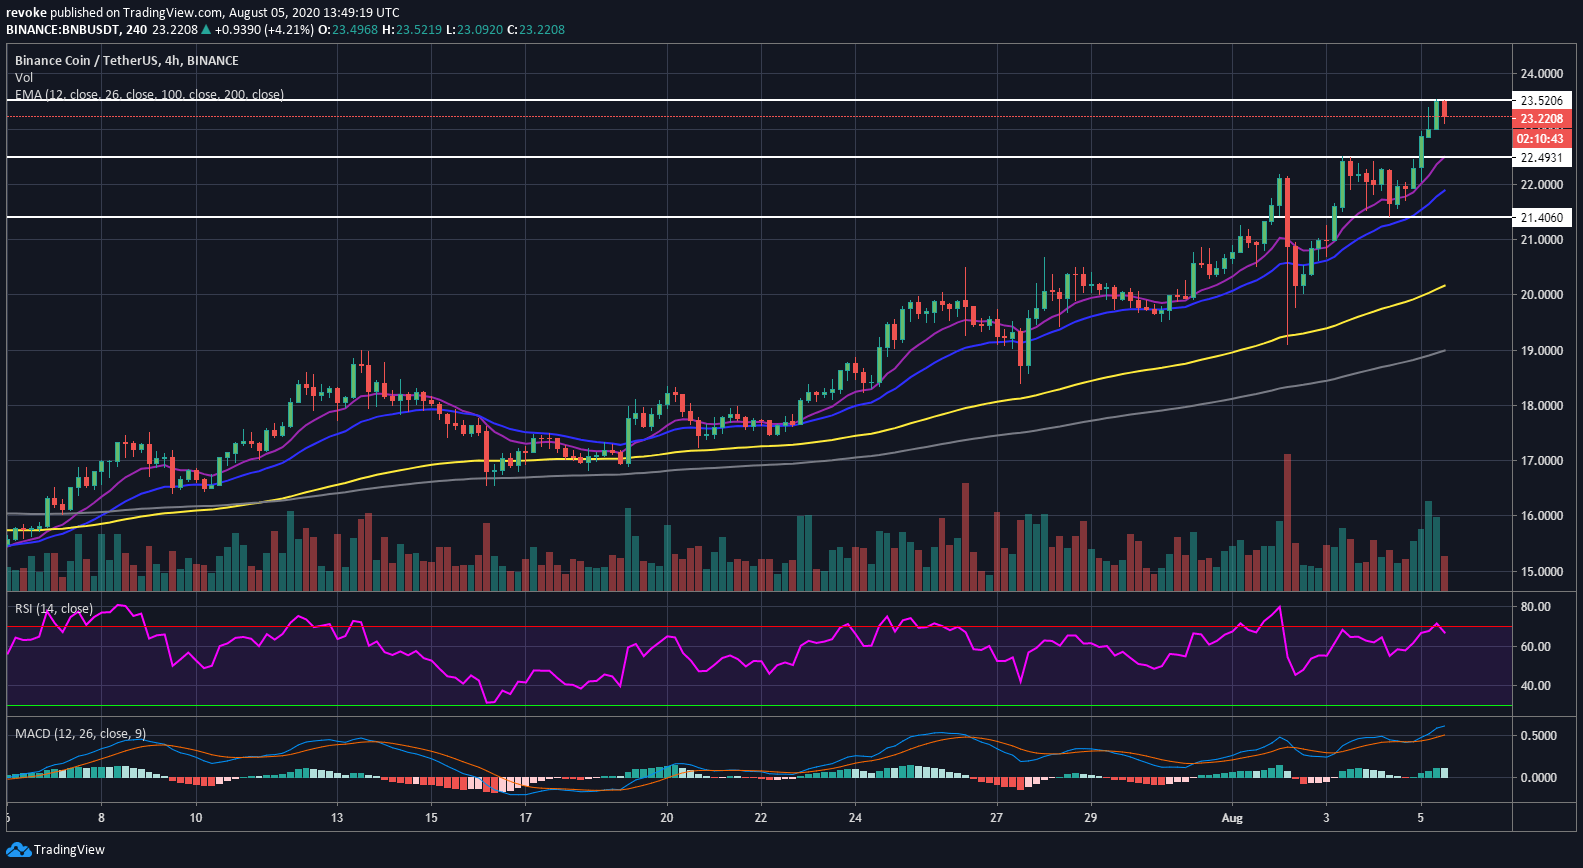
Binance Coin is currently in a sturdy daily uptrend after a significant indicator crossed bullishly. The 100-EMA and the 200-EMA crossed on August 1 for the first time since March 2019. BNB is currently trading at $23.54 and only faces a crucial resistance level at $27.19, the 2020-high.
BNB/USD 4-hour chart
BNB was having a hard time breaking above $23 but the bulls managed to defend the 4-hour 12-EMA at $21.71 on August 4 and bounced above $23 peaking at $23.54 before a brief pullback. The RSI was slightly overextended while the MACD remained bullish.
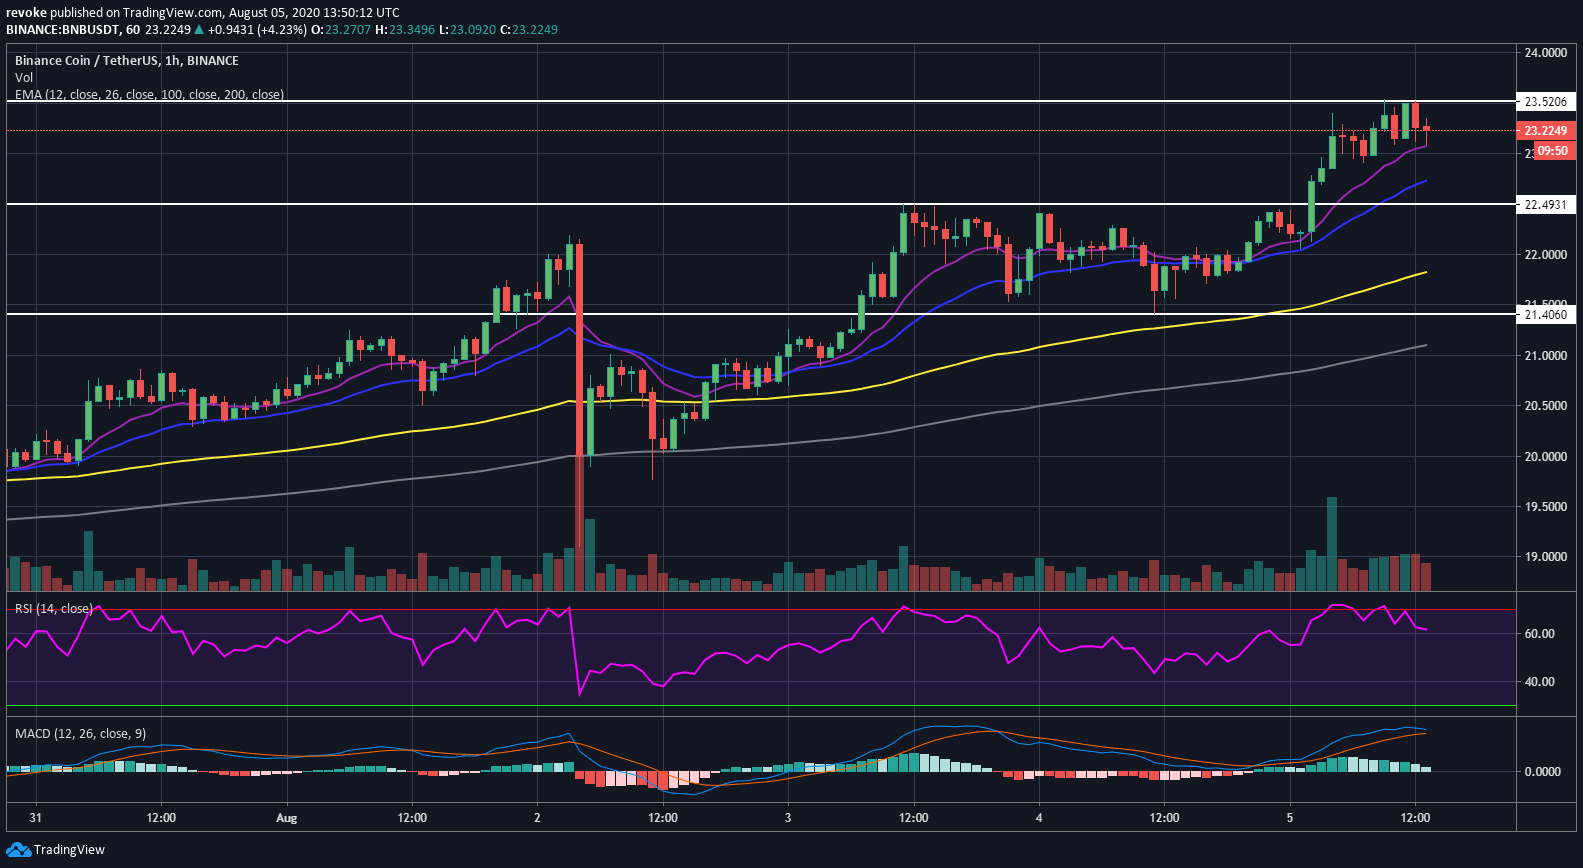
BNB/USD 1-hour chart
Buyers are defending the 12-EMA at $23.07 while the RSI is cooling off. The MACD is slowly turning bearish as BNB continues trading sideways.
Information on these pages contains forward-looking statements that involve risks and uncertainties. Markets and instruments profiled on this page are for informational purposes only and should not in any way come across as a recommendation to buy or sell in these assets. You should do your own thorough research before making any investment decisions. FXStreet does not in any way guarantee that this information is free from mistakes, errors, or material misstatements. It also does not guarantee that this information is of a timely nature. Investing in Open Markets involves a great deal of risk, including the loss of all or a portion of your investment, as well as emotional distress. All risks, losses and costs associated with investing, including total loss of principal, are your responsibility. The views and opinions expressed in this article are those of the authors and do not necessarily reflect the official policy or position of FXStreet nor its advertisers.