Binance Coin Price Prediction: Around $68 million worth of BNB burned could help the bulls
|- BNB is currently trading at $30.37 after several days of sideways price action.
- Binance conducted the 13th quarterly burn, burning a total of 2,253,888 BNB, the highest ever in fiat terms.
Binance Coin was initial launched as an ERC-20 token before getting its own mainnet. The exchange started burning coins in October 2017 starting with only 986,000 coins. Since then, Binance has completed quarterly coin burns reducing the total supply of BNB by more than 10%.
BNB eying up $33.34
The first few BNB burns had a stronger immediate effect on the price of BNB, however, the more recent ones haven’t pushed the price of the digital asset directly. They are now viewed as a more long-term bullish indicator without pumping the value of the digital asset.
BNB/USD daily chart
-637387211954316904.png)
Nonetheless, massive burns like the last one have a huge positive impact in the long-term. The price of BNB is currently way above the 50-SMA, 100-SMA, and 200-SMA. There are two clear resistance levels on the way up, the most recent one was established at $31.35 and the next is $33.34, the 2020-high.
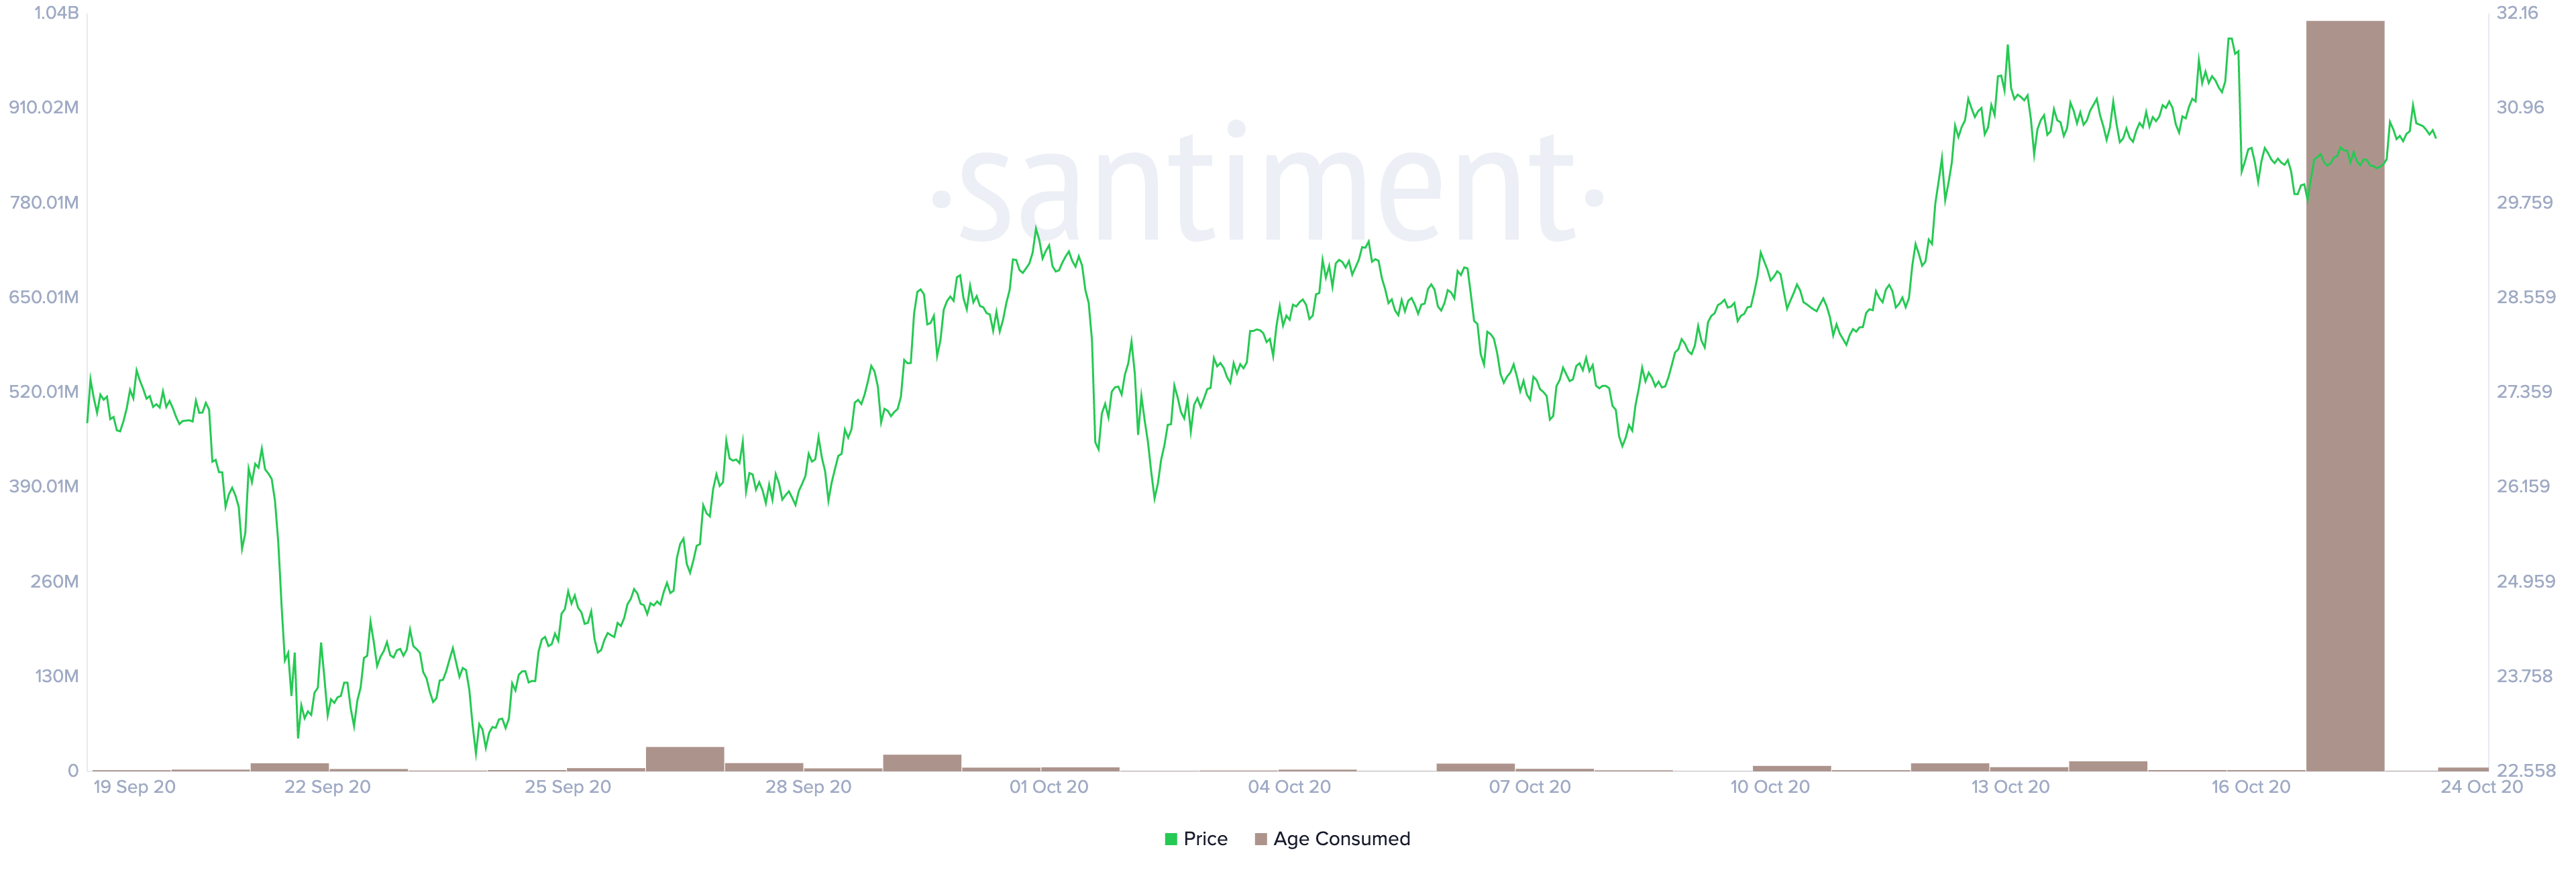
BNB Age Consumed Chart
Santiment shows a massive spike in the age consumed of BNB, related to the burn of BNB, but not entirely just from that. This metric shows the number of tokens changing addresses keeping in mind the last time they moved. A large spike like the one currently usually indicates that a lot of tokens are moving after being idle for quite some time.
Considering the trading volume seems to be dropping on Binance, we could be on the verge of a massive price move. As long as the bulls can push BNB above $31.35, the digital asset can easily reach the 2020-high at $33.34 and potentially run higher.
BNB/USD 12-hour chart
-637387212042135931.png)
On the other hand, it seems that the 12-hour chart is shifting in favor of the bears. BNB established a weak higher high at $31.97 compared to $31.79 followed by a lower high at $31.03. Bears are now trying to push the price below $29.57 to form a lower low and confirm a downtrend.
Additionally, the MACD flipped bearish on October 16 and it’s gaining strength. The next potential price target for the bears if $29.57 is broken would be $28.5 where the 100-SMA is currently established. The 50-SMA at $26.82, which coincides with a support level would be the next price target.
Key price points to look for
The recent BNB burn is a huge positive long-term indicator as Binance has burned more than 10% of the total supply of the digital asset. Bulls are facing one critical resistance level at $31.35. If broken, BNB can easily reach $33.34 and potentially run higher.
On the flip side, it seems that bears are taking control of the 12-hour chart. The MACD is bearish and a breakout below $29.57 would most likely drive the price of BNB down to $28.5 and as low as $26.82, a strong support level.
Information on these pages contains forward-looking statements that involve risks and uncertainties. Markets and instruments profiled on this page are for informational purposes only and should not in any way come across as a recommendation to buy or sell in these assets. You should do your own thorough research before making any investment decisions. FXStreet does not in any way guarantee that this information is free from mistakes, errors, or material misstatements. It also does not guarantee that this information is of a timely nature. Investing in Open Markets involves a great deal of risk, including the loss of all or a portion of your investment, as well as emotional distress. All risks, losses and costs associated with investing, including total loss of principal, are your responsibility. The views and opinions expressed in this article are those of the authors and do not necessarily reflect the official policy or position of FXStreet nor its advertisers.