Akropolis Technical Analysis: AKRO/USD explodes 60% towards $0.036
|- AKRO/USD has seen a massive surge in trading volume hitting $0.036.
- AKRO is now close to its all-time high of $0.05 in July 2019.
Akropolis has been riding the daily 12-EMA for basically a month. AKRO is trading inside a healthy and sturdy daily uptrend and has exploded in the last 24 hours cracking $0.03 after a massive 60% price surge.
AKRO/USD 4-hour chart
The increasing bull volume is a great sign for AKRO bulls. There are practically no resistance levels to the upside until the all-time high at $0.05. Bulls have established a few support levels on the way up but they can also use the daily 12-EMA and the 26-EMA.
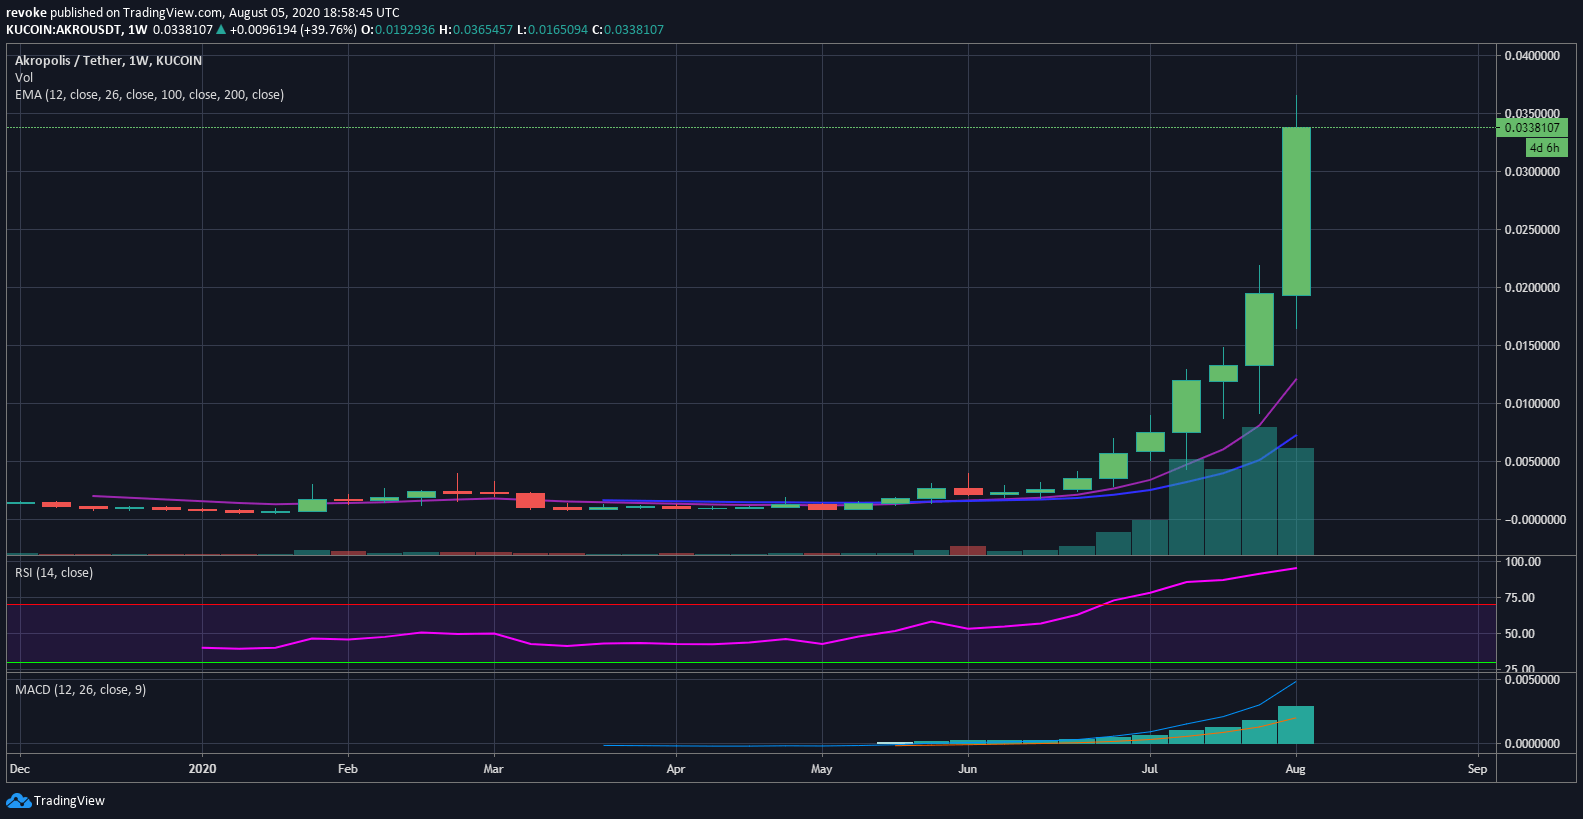
AKRO/USD weekly chart
The weekly chart is clearly bullish with an RSI level almost touching 100. The insane explosion in trading volume continues pushing AKRO to new highs every week.
Information on these pages contains forward-looking statements that involve risks and uncertainties. Markets and instruments profiled on this page are for informational purposes only and should not in any way come across as a recommendation to buy or sell in these assets. You should do your own thorough research before making any investment decisions. FXStreet does not in any way guarantee that this information is free from mistakes, errors, or material misstatements. It also does not guarantee that this information is of a timely nature. Investing in Open Markets involves a great deal of risk, including the loss of all or a portion of your investment, as well as emotional distress. All risks, losses and costs associated with investing, including total loss of principal, are your responsibility. The views and opinions expressed in this article are those of the authors and do not necessarily reflect the official policy or position of FXStreet nor its advertisers.