Torchlight Energy resources ($TRCH) moving higher
|Oil has hard a remarkable rally from the March 2020 low, and further upside is favoured to take place in the energy sector still. There is one energy producer that has vastly outperformed many other producers, Torchlight Energy Resources. From an all time low of 21 cents set in September 2020, to the recent peak of 4.83, this stock represents high volatility price action. Lets take a look at the company profile and see what they do:
“Torchlight Energy Resources, Inc. (NASDAQ: TRCH), based in Plano, Texas, is a high growth oil and gas Exploration and Production (E&P) company with a primary focus on acquisition and development of highly profitable domestic oil fields. The company currently holds interests in Texas where their targets are established plays such as the Permian Basin and the Eagle Ford Shale.”
lets dig into the charts!
Torchlight Energy Resources Elliott wave View:
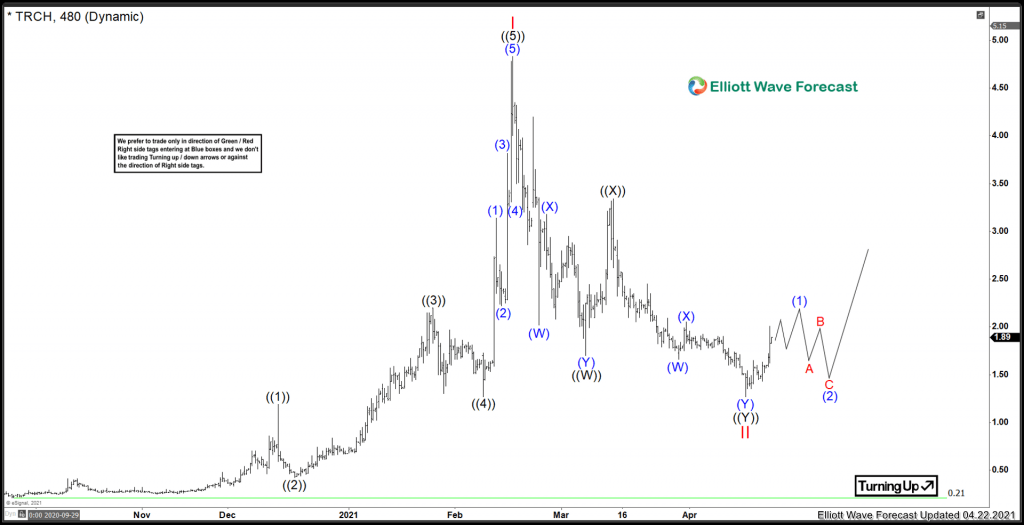
extraordinary. The rally from the 0.21 September low to the 4.83 February peak represents a 2300% return within a few short months. It can be expected that a long and deep correction can be expected from such a rally. There is a clear 5 waves structure heading into the Feb peak. Coming out of an all time low in September 2020, this peak can be counted as the first wave of a long extended rally. From the Red I peak, prices sharply fell in a double correction ((W)) wave. After that, a connector in ((X)). After that, another swing lower to form a low in Red II.
The RSI momentum at the Red II low has a very extreme reading. Should the stock continue to fall lower than 1.27, it would likely diverge in momentum. This would would point to a more prolonged correction in time and price. For now, the bottom is favoured to be set as long as $1.27 level holds. Presently, the expectation is for a rally into blue (1) before pulling back in (2), and then further extension higher.
Information on these pages contains forward-looking statements that involve risks and uncertainties. Markets and instruments profiled on this page are for informational purposes only and should not in any way come across as a recommendation to buy or sell in these assets. You should do your own thorough research before making any investment decisions. FXStreet does not in any way guarantee that this information is free from mistakes, errors, or material misstatements. It also does not guarantee that this information is of a timely nature. Investing in Open Markets involves a great deal of risk, including the loss of all or a portion of your investment, as well as emotional distress. All risks, losses and costs associated with investing, including total loss of principal, are your responsibility. The views and opinions expressed in this article are those of the authors and do not necessarily reflect the official policy or position of FXStreet nor its advertisers.