GBP/USD faces an uphill battle and the recovery is in danger — Confluence Detector
|The Pound managed to stabilize and got off the lows. But where will it go next? As the day that services sector data are published, the GBP/USD faces tough hurdles.
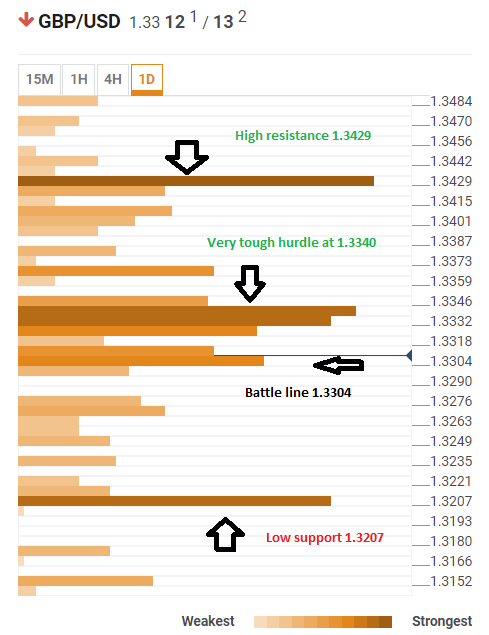
The Technical Confluences Indicator shows that the pair faces a very dense cluster of resistance lines around 1.3340. This is the confluence of the Bolinger Band one-hour-Middle, the Simple Moving Average 50-1h, the SMA 200-15m, the Fibonacci 38.2% one-day, the SMA 100-15m, the Bolinger Band one-hour-Middle, the Fibonacci 23.6% one-week, the SMA 10 one day, and the SMA 5-4h.
If the pair does overcome this dense cluster, the next cap is at 1.3429 which is the convergence of the all-important Fibonacci 38.2% one-month and the Bolinger Band one-day Middle.
The pair faces immediate support around 1.3304 which is the confluence of the Simple Moving Average 5-one day, the Fibonacci 38.2% one-week, and the one-day high.
Yet if Sterling loses this area, there are only weak lines of support until 1.3207 which is the congestion of the one-month low, the one-week low, and the Bolinger Band one-day Lower.
The pair is around 100 pips off the lows, but an extended recovery may be hard.
This is how it looks on the tool:
Confluence Detector
The Confluence Detector finds exciting opportunities using Technical Confluences. The TC is a tool to locate and point out those price levels where there is a congestion of indicators, moving averages, Fibonacci levels, Pivot Points, etc. Knowing where these congestion points are located is very useful for the trader, and can be used as a basis for different strategies.
This tool assigns a certain amount of “weight” to each indicator, and this “weight” can influence adjacents price levels. This means that one price level without any indicator or moving average but under the influence of two “strongly weighted” levels accumulate more resistance than their neighbors. In these cases, the tool signals resistance in apparently empty areas.
Information on these pages contains forward-looking statements that involve risks and uncertainties. Markets and instruments profiled on this page are for informational purposes only and should not in any way come across as a recommendation to buy or sell in these assets. You should do your own thorough research before making any investment decisions. FXStreet does not in any way guarantee that this information is free from mistakes, errors, or material misstatements. It also does not guarantee that this information is of a timely nature. Investing in Open Markets involves a great deal of risk, including the loss of all or a portion of your investment, as well as emotional distress. All risks, losses and costs associated with investing, including total loss of principal, are your responsibility. The views and opinions expressed in this article are those of the authors and do not necessarily reflect the official policy or position of FXStreet nor its advertisers.