GBP/USD could lose 1.3000 after falling to a 7-month low — Confluence Detector
|The GBP/USD is trading at the 1.30 handle, extending its losses. Where will it find support?
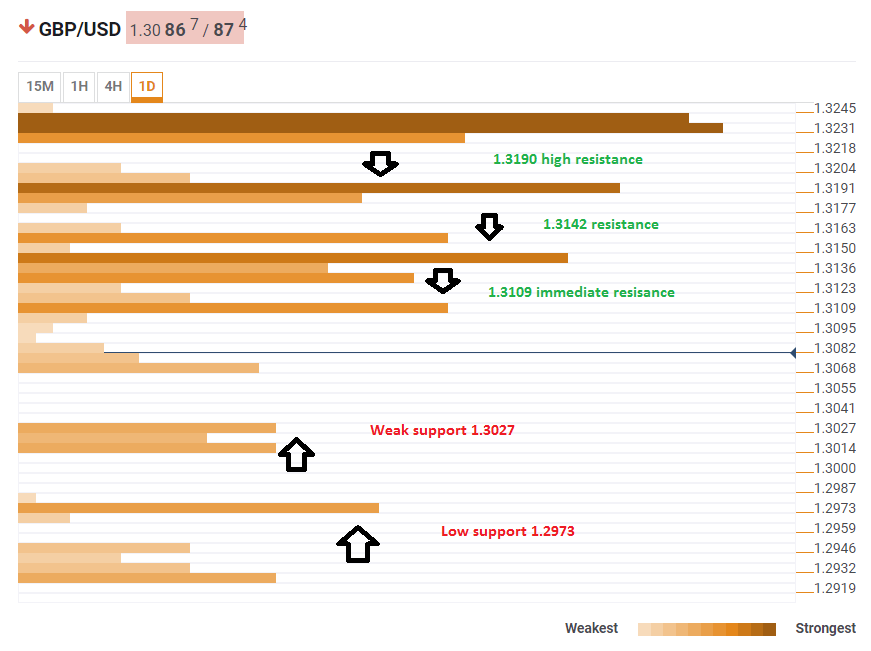
The Technical Confluences Indicator shows that the pair has a bit of support at 1.3027, which is the convergence of the Pivot Point one-day Support 2 and the Pivot Point one-week Support 2. However, this is a weak line.
Further down, a more potent line is already below 1.3000. At 1.2973 we see the Fibonacci 161.8% one-week.
Looking up, we already see significant resistance at 1.3109 which is the 4h-high, the one-day high, the Bolinger Band 15m-Middle, the Bolinger Band one-hour Lower, the Simple Moving Average 50-15m and more.
It is followed closely by the 1.3142 which is the congestion of the Fibonacci 23.6% one-day, the Pivot Point one-week Support 1, the Bolinger Band 15m-Upper, and the Simple Moving Average 5-4h. Even higher, 1.3190 is the confluence of the Fibonacci 61.8% one-week, the Fibonacci 61.8% one-day, the Simple Moving Average 200-15m, the SMA 50-15m and more.
All in all, the pair may find it easier to fall than to recover.
This is how it looks on the tool:
Confluence Detector
The Confluence Detector finds exciting opportunities using Technical Confluences. The TC is a tool to locate and point out those price levels where there is a congestion of indicators, moving averages, Fibonacci levels, Pivot Points, etc. Knowing where these congestion points are located is very useful for the trader, and can be used as a basis for different strategies.
This tool assigns a certain amount of “weight” to each indicator, and this “weight” can influence adjacents price levels. This means that one price level without any indicator or moving average but under the influence of two “strongly weighted” levels accumulate more resistance than their neighbors. In these cases, the tool signals resistance in apparently empty areas.
Information on these pages contains forward-looking statements that involve risks and uncertainties. Markets and instruments profiled on this page are for informational purposes only and should not in any way come across as a recommendation to buy or sell in these assets. You should do your own thorough research before making any investment decisions. FXStreet does not in any way guarantee that this information is free from mistakes, errors, or material misstatements. It also does not guarantee that this information is of a timely nature. Investing in Open Markets involves a great deal of risk, including the loss of all or a portion of your investment, as well as emotional distress. All risks, losses and costs associated with investing, including total loss of principal, are your responsibility. The views and opinions expressed in this article are those of the authors and do not necessarily reflect the official policy or position of FXStreet nor its advertisers.