Forex Strength and Comparison for Week 40
|Welcome to my "Strength and Comparison" article for the coming week.
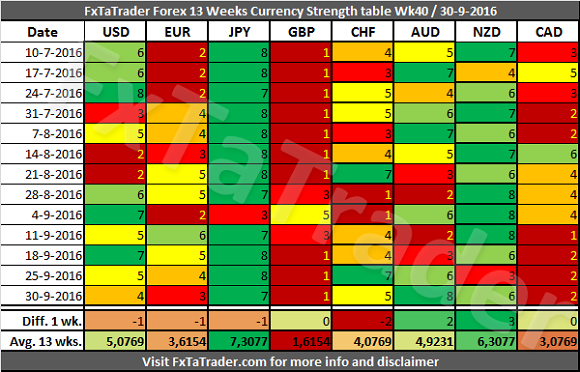
When looking at the Currency Strength in the table here below we can see that the CAD lost a lot of strength in the last 4 weeks. The CHF and the AUD became stronger in the last week and the USD became weaker in the last 2 weeks. For more details read both of my articles where the necessary Charts and Tables are provided.
______________________________________
13 Weeks Currency Score Strength
The 13 Weeks Currency Strength and the 13 Weeks Average are provided here below. This data and the "13 weeks Currency Classification" are considered for deciding on the preferred range. Because it is not ideal nor desired to change the range for a currency every single week, we perform several checks to avoid this.
- First of all the strength over a period of 13 weeks. See each row for more information.
- Then the 13 weeks average, see the last row called "Avg. 13 wks."
- The number of weeks that a currency is stronger than another currency can also be evaluated.
- The TA Charts for each Time Frame can also be consulted.
For analyzing the best pairs to trade looking from a longer term perspective the last 13 weeks Currency Classification can be used in support.
This was updated on 25 September 2016 and is provided here for reference purposes:
Strong: USD, JPY, NZD. The preferred range is from 6 to 8.
Average: CHF, AUD. The preferred range is from 4 to 5.
Weak: EUR, GBP, CAD. The preferred range is from 1 to 3.
_____________________________________
The Strong Currencies
In the last 2 weeks the USD became weaker. According to the Currency Strength table here above the Avg. 13 Weeks of the USD is slightly higher compared to the AUD which is an average currency. The USD scored also only 7 times higher than the AUD in the last 13 weeks. Some Classification changes may occur in the coming weeks with the mentioned currencies.
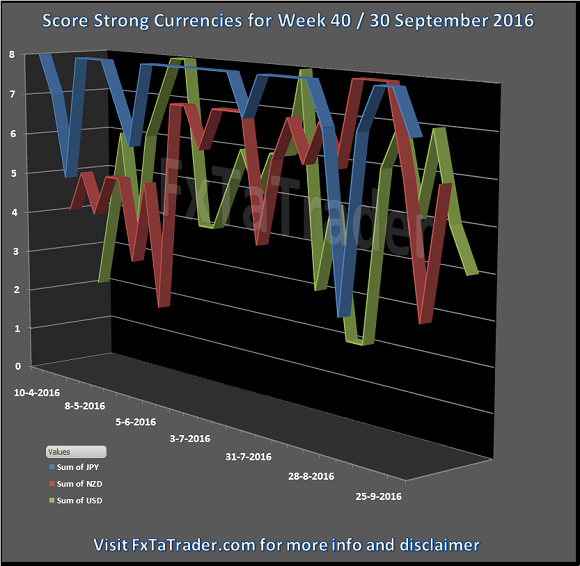
The JPY is clearly the strongest currency and the NZD had a 1 bad week but recovered. Here below you can see the Weekly Currency Score Chart with 6 months data as a reference.
____________________________________
Currency Score Comparison
"Comparison table" and the "Ranking and Rating list"
The Forex Currency Comparison Table compares each currency with its counterpart based on the Currency Score. For more information about the currency Score of this week you can read the article "Forex Ranking, Rating and Score" which is published every week together with this article.
By using the comparison table directly below you can get a view without the volatility and statistics as opposed to the "Ranking and Rating list". Only the strength of each currency against the counterparts is analyzed by using the Technical analysis charts of the 4 Time Frames that are also used for the "Ranking and Rating List".
The information from the Comparison Table is the source for calculating the "Ranking and Rating List" where this list additionally uses the volatility and statistics for creating the best and worst performer in the list from number 1 to 28.
"Comparison table" and the "Currency Score Chart"
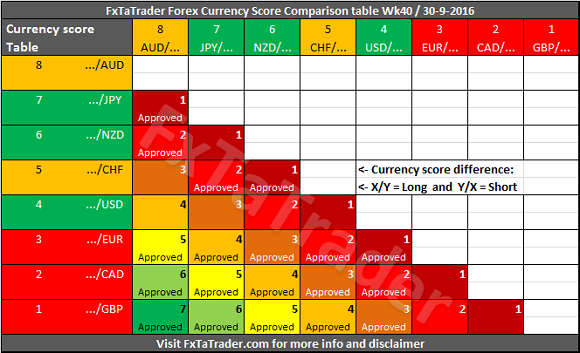
The additional value of this table compared to the Currency Score table is that the Comparison Table compares the strength between the currencies of each pair. By subtracting the strength of the weaker currency from the stronger currency we have a way to compare each pair combination.
The comparison table provides a way to compare currencies from a longer term perspective of 13 weeks and also simultaneously taking the current trend into account. By coloring the currencies in the X and Y axis according to their Classification we can show what the best combinations are. In doing this we apply 2 rules to make it clearer.
- First of all only better classified currencies in combination with weaker classified currencies are "Approved" when there is a Currency Score difference of at least 1 in the current week.
- The only exception is when 2 currencies are similarly classified but the Currency Score difference is equal to or more than 4.
- It means that each currency should be as far apart from each other as possible in the range from 1 to 8. The classification of the currencies in question may change in the longer term. By using the difference of 4 which is exact at the half of the range it seems a safe approach for trading 2 currencies which are similarly classified.
- Even though currencies may be in the same classification a currency may be in a weaker/stronger period and may even change its classification in the future. See the current classification for the coming period at the beginning of this article.
______________________________________
Putting the pieces together
Based on the last "13 Weeks currency classification" and the "Currency Comparison Table" the most interesting currencies for going long seem to be the:
AUD, JPY and NZD.
These are strong or average currencies from a longer term perspective when looking at the last "13 Weeks currency classification".
For going short the same analysis can be done and the following currencies seem to fit best:
GBP, CAD and EUR.
These are weak or average currencies from a longer term perspective.
Currencies with a high deviation seem less interesting to trade because they are less predictable. These currencies seem to be at the moment e.g. the:
AUD and USD.
Unless these currencies offer a clear opportunity based on the longer term it seems best to be avoided. However, these currencies may offer opportunities for the short term trader.
Some of the pairs in the "Currency Comparison Table" comply for a longer term trade based on the Technical Analysis (TA) of the Daily and Weekly chart. For the coming week these seem to be: GBP/AUD, GBP/NZD, AUD/CAD and EUR/AUD.
Information on these pages contains forward-looking statements that involve risks and uncertainties. Markets and instruments profiled on this page are for informational purposes only and should not in any way come across as a recommendation to buy or sell in these assets. You should do your own thorough research before making any investment decisions. FXStreet does not in any way guarantee that this information is free from mistakes, errors, or material misstatements. It also does not guarantee that this information is of a timely nature. Investing in Open Markets involves a great deal of risk, including the loss of all or a portion of your investment, as well as emotional distress. All risks, losses and costs associated with investing, including total loss of principal, are your responsibility. The views and opinions expressed in this article are those of the authors and do not necessarily reflect the official policy or position of FXStreet nor its advertisers.