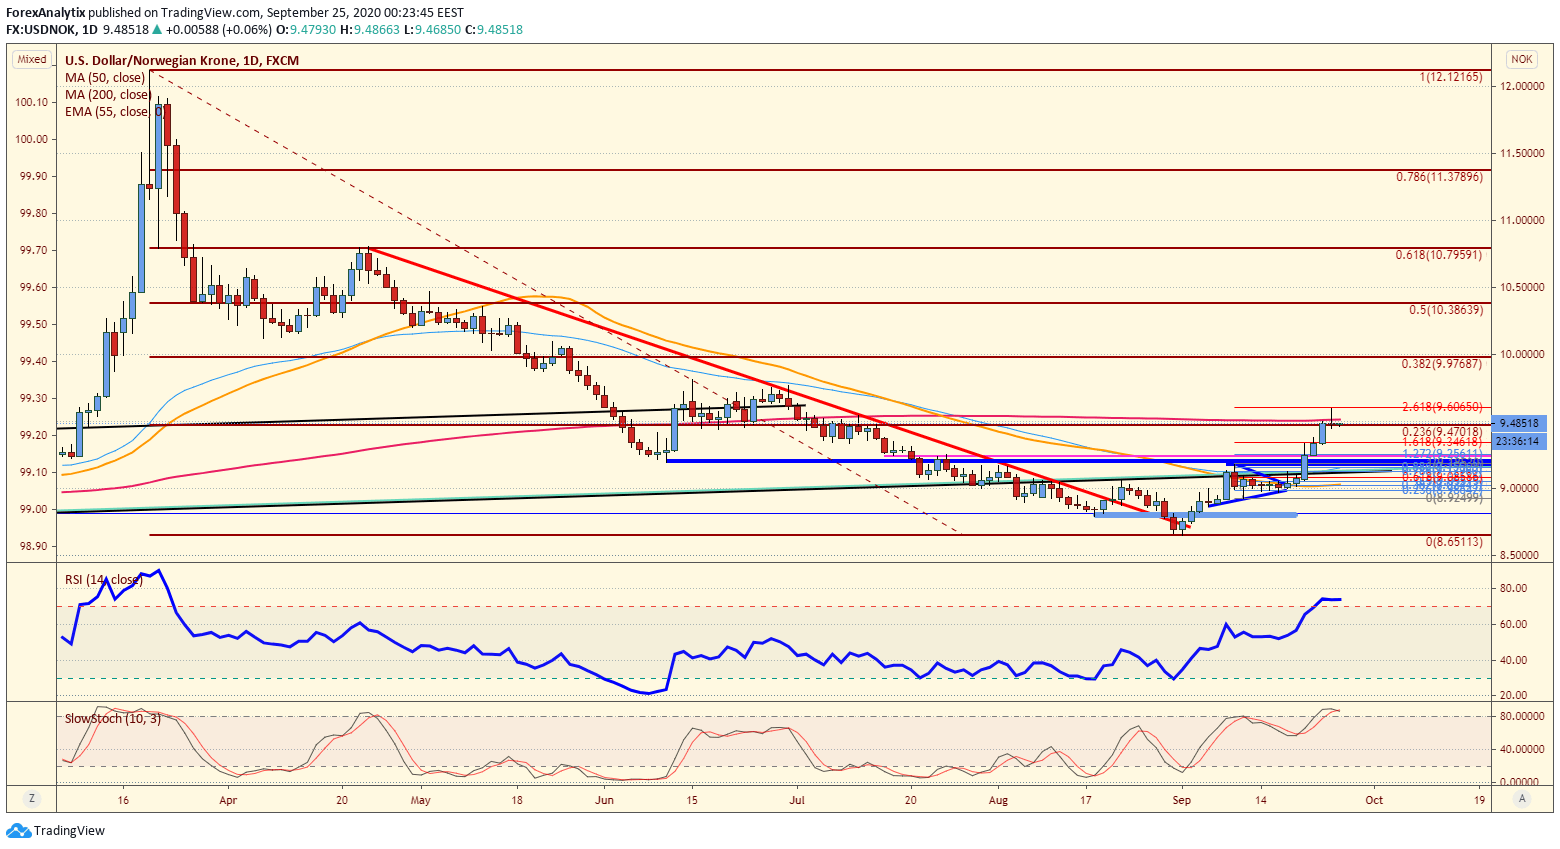
Chart of the day: USD/NOK
|When the USD/NOK broke the 9.2000 level the bears were squeezed and squeezed hard. We rallied today above the 200dma before pulling back and closing below the 200dma. But we are also at the 24% retracement of the March highs to recent lows which means we could still have further to rally. The 38% Fibonacci retracement level is at the 9.9768 level, just shy of the big figure. While we trade above the 9.2000 level we'd think bulls will be looking for that 38% level in the weeks ahead.
Information on these pages contains forward-looking statements that involve risks and uncertainties. Markets and instruments profiled on this page are for informational purposes only and should not in any way come across as a recommendation to buy or sell in these assets. You should do your own thorough research before making any investment decisions. FXStreet does not in any way guarantee that this information is free from mistakes, errors, or material misstatements. It also does not guarantee that this information is of a timely nature. Investing in Open Markets involves a great deal of risk, including the loss of all or a portion of your investment, as well as emotional distress. All risks, losses and costs associated with investing, including total loss of principal, are your responsibility. The views and opinions expressed in this article are those of the authors and do not necessarily reflect the official policy or position of FXStreet nor its advertisers.