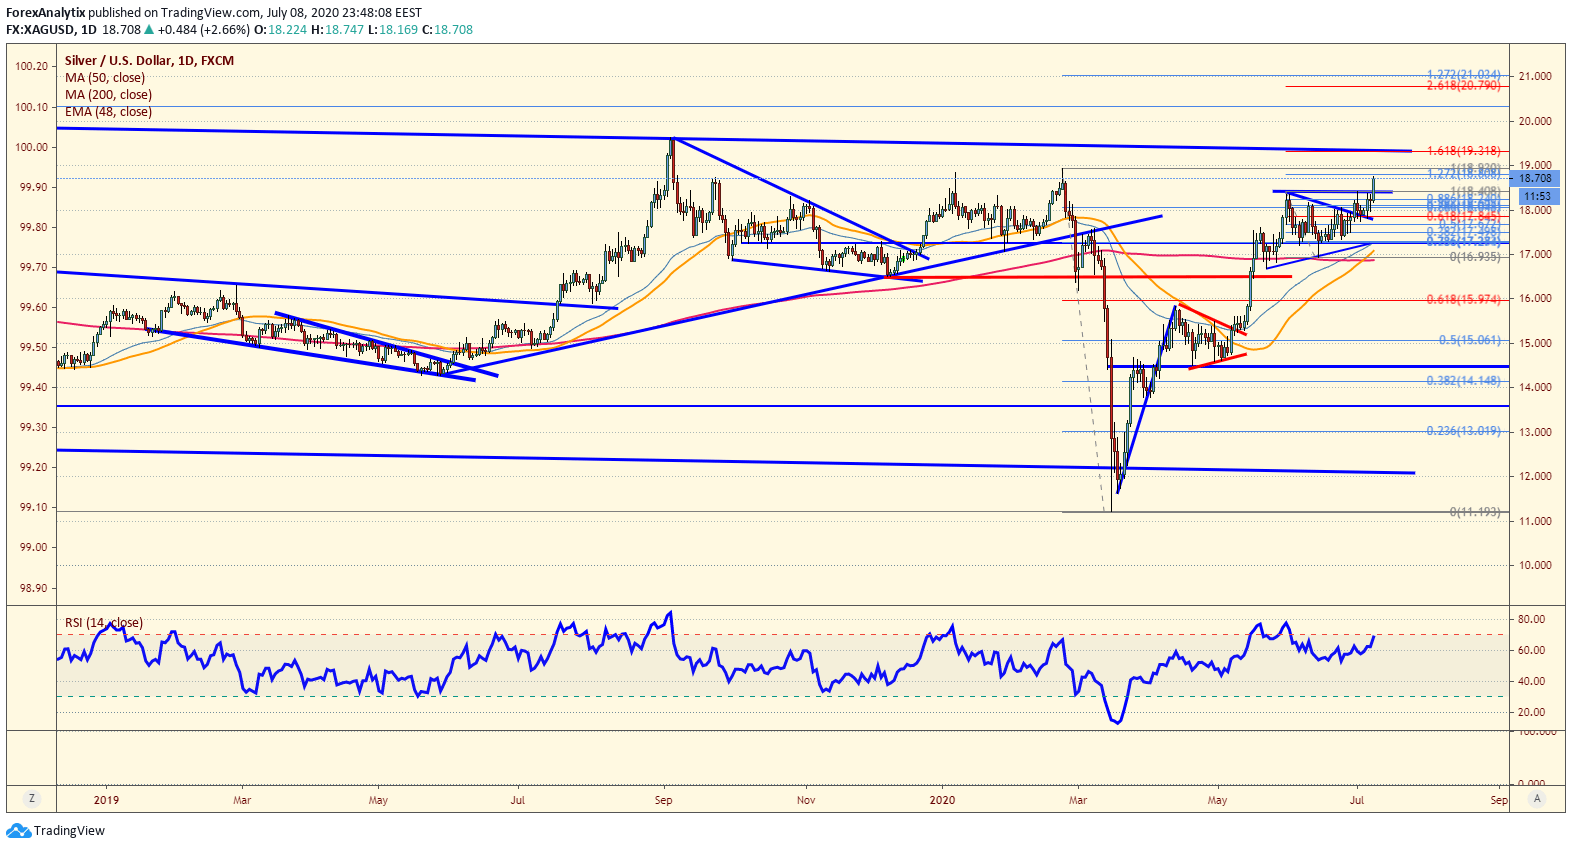
Chart of the day: Silver
|Silver may test "channel resistance" which is the channel silver has been in since 2014 (July) and tested it in 2016, 2019 and may get tested once again. This level comes in at the 19.25 level. This is also the 161% extension of the recent triangle breakout as well (19.31). We should take into consideration that the daily RSI is nearing overbought and divergent. Also, the DSI (daily sentiment index) is registering at a high 89, which suggests bulls are at an extreme. That is why a test of this long term channel may be significant resistance if we reach it.
Information on these pages contains forward-looking statements that involve risks and uncertainties. Markets and instruments profiled on this page are for informational purposes only and should not in any way come across as a recommendation to buy or sell in these assets. You should do your own thorough research before making any investment decisions. FXStreet does not in any way guarantee that this information is free from mistakes, errors, or material misstatements. It also does not guarantee that this information is of a timely nature. Investing in Open Markets involves a great deal of risk, including the loss of all or a portion of your investment, as well as emotional distress. All risks, losses and costs associated with investing, including total loss of principal, are your responsibility. The views and opinions expressed in this article are those of the authors and do not necessarily reflect the official policy or position of FXStreet nor its advertisers.