XAG/USD trades below the three-week high level of $22.00
- Silver slides after reaching a March high, following a significant increase not seen since early November 2022.
- XAG/USD starts the day with a lower open price of $20.54 before climbing to an intraday price of $21.70.
- The price movements are relatively narrow, with the highest and lowest intraday prices being $21.92 and $21.62, respectively.
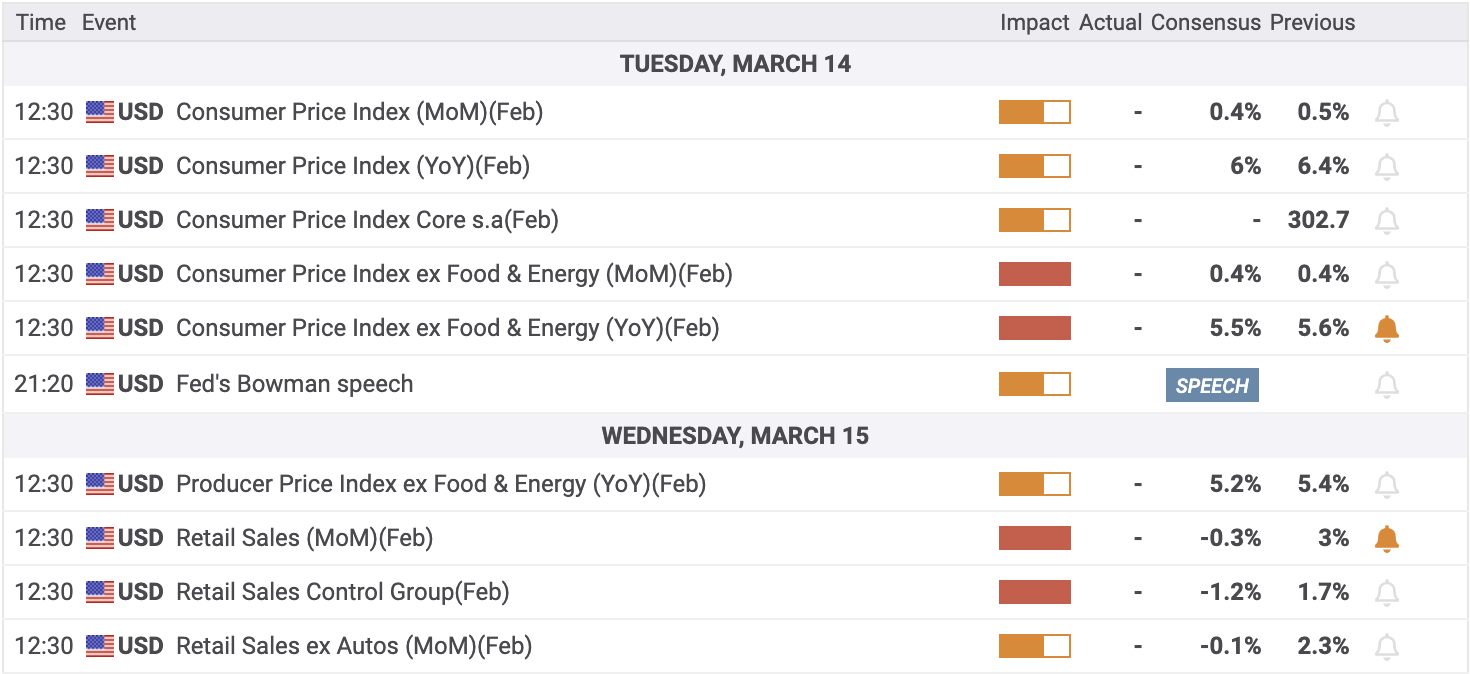
- Traders cautiously watch Tuesday’s US CPI and Wednesday’s US Retail Sales data.
Daily price movements:
Silver (XAG/USD) starts the day on a slightly bearish note, with a lower open price of $20.54 compared to the close price of the previous day. However, the XAG/USD currency pair climbs back up and trades at $21.70, still 0.47% down from its previous close of $21.81 at the press time, with a narrow intraday price range of $21.92 to $21.62. The market sentiment remains mixed ahead of Tuesday’s US inflation data.
After Silicon Valley Bank's (SVB) collapse, the banking sector's condition has raised concerns, leading to a decrease in expectations for a rate hike by the Federal Reserve (Fed). Investors are watching how this crisis and US Inflation data – to be announced on Tuesday at 15:30 GMT – could impact.
Key economic events:
US February Consumer Price Index (CPI) (Feb) on Tuesday at 12:30 GMT and US February Retail Sales on Wednesday at 12:30 GMT are crucial for monetary expectations and are closely watched. However, the unfortunate SVB collapse has resulted in markets anticipating a more lenient stance by the Federal Reserve (Fed).
Technical view:
The daily chart shows XAG/USD trades above its 20-SMA of $21.05, indicating a short-term bullish trend. However, it is still below its daily 50-SMA of $22.36, suggesting a longer-term bearish bias. RSI(14) is at 59.43 at the time of press, indicating a buying stance.
The daily pivot point is $21.43, with daily resistance levels at $22.32, $22.82, and $23.71, and daily support levels at $20.93, $20.04, and $19.54.
Traders are advised to carefully monitor price movements ahead of the US inflation data and use appropriate risk management strategies.
Information on these pages contains forward-looking statements that involve risks and uncertainties. Markets and instruments profiled on this page are for informational purposes only and should not in any way come across as a recommendation to buy or sell in these assets. You should do your own thorough research before making any investment decisions. FXStreet does not in any way guarantee that this information is free from mistakes, errors, or material misstatements. It also does not guarantee that this information is of a timely nature. Investing in Open Markets involves a great deal of risk, including the loss of all or a portion of your investment, as well as emotional distress. All risks, losses and costs associated with investing, including total loss of principal, are your responsibility. The views and opinions expressed in this article are those of the authors and do not necessarily reflect the official policy or position of FXStreet nor its advertisers.