Understanding Technical Indicators
With every indicator there are common conventions on how they should be used. Indicators are frequently classified as “counter-trend”, “momentum”, or “volatility” indicators, to name a few. Yet many traders take this at face value without exploring what the indicators are actually measuring.
In this article we’ll cover three of the most common technical indicators, the Relative Strength Index (RSI), Bollinger Bands, as well as a Simple Moving Average Cross (SMA Cross), and how they can be used to identify different market conditions.
Let’s get started!
RSI
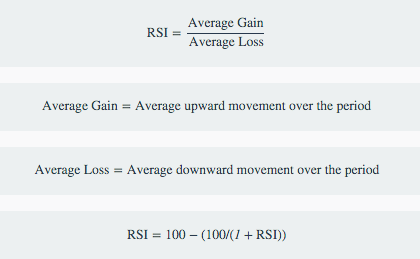
The RSI is one of the most widely-known technical indicators with many traders using it both to identify overbought and oversold conditions as well as to measure the strength of a trend. We’ll explore both applications but let’s first look at the underlying calculation:
So as the RS gets larger, i.e. the Average Gains grow larger than the Average Losses, the second part of the equation approaches 0 and the denominator approaches infinity, effectively leading to:
And as the RS gets smaller, i.e. the Average Gains are smaller than the Average Losses, the RSI approaches 0:
RSI as a Counter-Trend Indicator
Conventional wisdom uses the RSI as “Over 70 = Overbought” and “Under 30 = Oversold”. But what do those numbers really mean?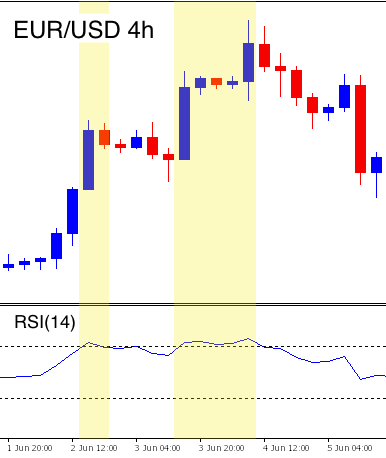
The 70 mark is reached when the Average Gains are 2.33 larger than the Average Losses (the opposite being true for the 30 RSI value). The logic is that anytime the Average Gains are that much larger than the average losses the market is due for a correction.
Depending on the asset and timeframe you are trading, 2.33 times larger may be enough but it could just as easily signify a growing trend. If you were looking for a more pronounced difference, such as the Average Gains being 4 times larger than the Average Losses, you would want to look for an RSI value of 80 (or 20 to go long). This leads to a much more pronounced reversion from the mean but could also signify a strong breakout.
RSI as a Trend-Following Indicator
The RSI, looking at the underlying calculation, is measuring the strength of a trend by comparing the size of the upward movements to the size of downward movements. As the upward movements become larger than the downward movements we are thought to be in an uptrend. Can it be that simple?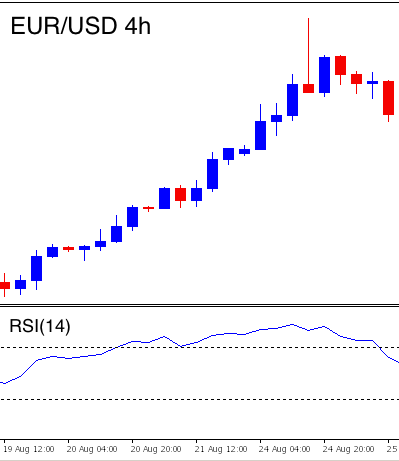
Not quite. Let’s take the case where the RSI is at 60, meaning the Average Gains are 1.5 times larger than the Average Losses. This seems like the market could be in a moderate bullish trend. But what if the previous RSI value was 65? So the Average Gains used to be almost 2 times the Average Losses but they have been getting smaller. The trend would appear to be diminishing.
In order to use the RSI as a Trend-Following indicator, you want to look at where it is compared to its most recent range. For example, if the RSI has ranged between 55 and 45 for the last week and suddenly breaks above 60, there’s a good chance you are in an uptrend.
To do this we can use the Stochastic RSI. The Stochastic RSI applies the Stochastic formula to the RSI to give you a sense of where the current value is relative to the most recent range:
High Stochastic RSI values mean that the RSI is in the top of its range, signaling a potential bullish trend, while low Stochastic RSI values show that it is in the bottom of its range and demonstrate a bearish trend.
Information on these pages contains forward-looking statements that involve risks and uncertainties. Markets and instruments profiled on this page are for informational purposes only and should not in any way come across as a recommendation to buy or sell in these assets. You should do your own thorough research before making any investment decisions. FXStreet does not in any way guarantee that this information is free from mistakes, errors, or material misstatements. It also does not guarantee that this information is of a timely nature. Investing in Open Markets involves a great deal of risk, including the loss of all or a portion of your investment, as well as emotional distress. All risks, losses and costs associated with investing, including total loss of principal, are your responsibility. The views and opinions expressed in this article are those of the authors and do not necessarily reflect the official policy or position of FXStreet nor its advertisers.