Trading stocks with triangles
|By Bramesh Bhandari
Price patterns are a powerful, elegant tool for market analysis. Not only can you apply them without additional indicators or tools, but because patterns reflect price directly, there often is little to no lag between signals and subsequent price movement. These relationships are just as strong in equities as they are in commodity markets.
Stock traders can use price patterns to set up positions, time trades with a fundamental basis or as a signal to take money out of the market. They can operate as an early warning system because of their minimal lag, or as a buy or sell trigger within a larger trading approach.
Among price patterns, one of the most useful and simple is the triangle. As with all price patterns, triangles fall into one of two broad categories: Reversal or continuation. Reversal patterns signal that the previous trend will reverse upon completion of the pattern. Continuation patterns signal that the trend will continue upon completion of the pattern.
Playing with shapes
When the price of a stock trades in a range as time goes by and that range becomes smaller, it can be described as a triangle pattern. The process involves the contraction of price with the convergence of trendlines creating the triangle shape (see “Tightening price”).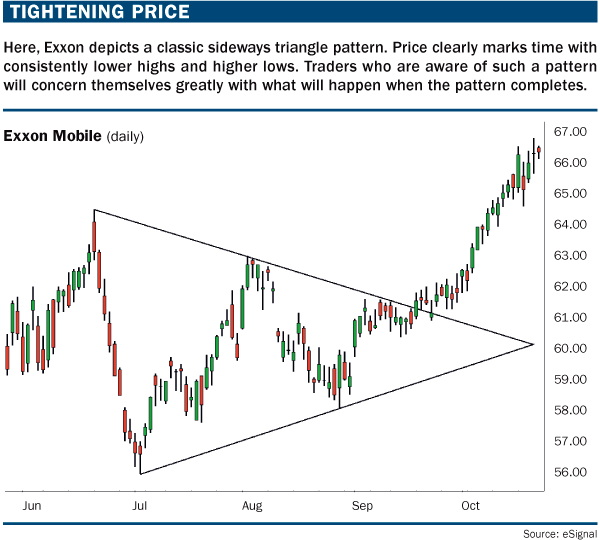
Triangle patterns generally mark a consolidation of the trend and are concluded with a strong breakout in either direction. Clearly, identifying a triangle pattern allows for trading opportunities not only during the formation of the pattern, but when price breaks out at the end of the formation.
How a triangle pattern plays out depends on the type of triangle it is. They generally fall into one of three categories:
- Symmetrical triangles
- Ascending triangles
- Descending triangles
Each pattern can be described in different terms with respect to price behavior and can be expected to generate a different type of price signal.
Symmetrical triangles
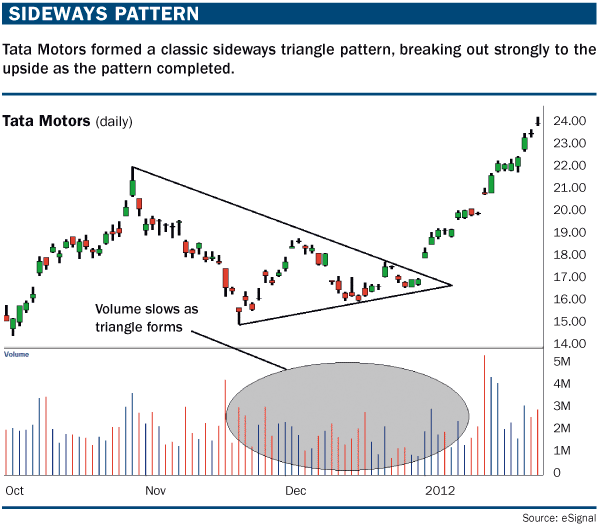
A symmetrical triangle pattern comprises price fluctuation where each swing high and swing low is smaller than the previous swing. Volume tends to fall as the pattern develops. A sharp increase in volume confirms any break higher from the dominant pattern. In general, trading activity diminishes until the apex of triangle is formed.A symmetrical triangle pattern should contain at least two lower highs and two lower lows. Also, the second high should be lower than the first high, with the upper trendline sloping downward. Similarly, the second low should be higher than the first low, with the lower trendline sloping higher.
As seen in “Sideways pattern” (below), Tata Motors is trading within the price range of $16 to $22. As time went by, Tata made lower highs of $19.60 and $18.50 to form a downward sloping trendline. Tata Motors also made higher lows of $16.70 and $16.90 to form an upward rising trendline. Also true to form, volume activity diminished with the contraction in the trading range. At the apex of the triangle, we witness a strong breakout upward.
There are two key components to a symmetrical triangle breakout: Price and volume. With regard to price, the breakout confirmation should be on a closing basis only. For an upside breakout, the stock should close decisively outside of the triangle formation with a pickup in volume. Breakdowns also require a decisive price break of the formation, but the volume does not need to display a significant increase in activity.
You can calculate the extent of the subsequent breakout move from a triangle formation by taking the difference between the top and bottom of the range and adding it to the breakout point. For Tata Motors, it would be $19.40 (the price at the breakout point) + $20.80 (the high of the range) – $16 (the low of the range) = $24.20. Keep in mind that this type of target calculation is a rough estimate, and price often trends higher (as it does in the Tata Motors example); however, the target typically is a good level to reduce market exposure or tighten risk control measures, such as stops.
Symmetrical triangles provide little, if any, indication as to which direction the stock ultimately will break out. This is not a problem because the nature of the formation allows for tight stops in case of false breakouts. Other types of triangles, however, can offer some clues.
Ascending triangles
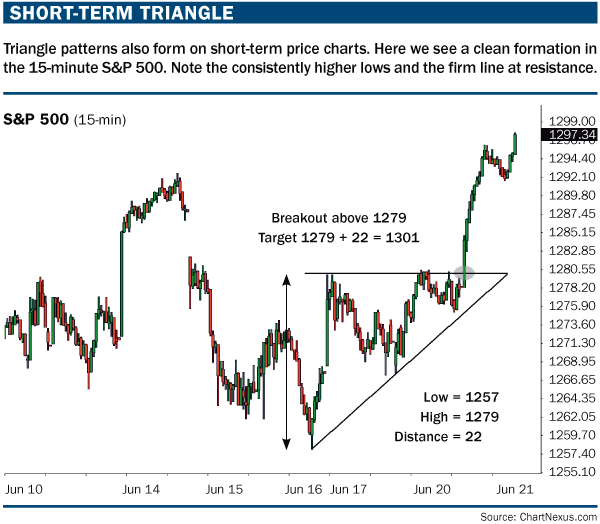
This pattern is made up of one trendline drawn horizontally to mark resistance and a second trendline connecting subsequent higher lows that mark support. An ascending triangle generally is a continuation pattern formed during a consolidation after an uptrend. Volume usually diminishes during the formation of the pattern.An ascending triangle should contain at least two similar highs, not exactly equal, but in rough proximity to each other, forming the upper horizontal trendline. At least two higher lows are required to form the lower ascending trendline. The standard trading approach is to set an entry order above the resistance line and a sell order below the slope of the higher lows.
The formation of an ascending triangle is rather strict, so if the stock sets a low equal to or less than the previous low, breaking the upward slope of the lows in the formation, then the triangle is invalidated.
As seen in “Short-term triangle” (below), 15-minute price action in the S&P 500 is unable to cross the resistance line of 1279 after at least five attempts. Each effort is met with selling pressure. Also, buyers start to gain strength as the S&P make higher lows — 1257 and 1265 — as shown in the chart.
Ascending triangles generally are considered to be bullish patterns, but that’s not always the case; they do break out on the downside, as well.
Descending triangles
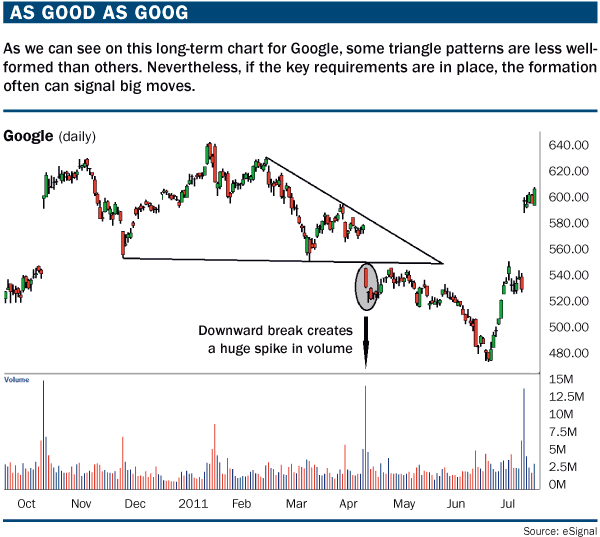
Descending triangle patterns include two trendlines, one drawn horizontally to mark support and a second trendline drawn downward identifying resistance. As with all triangles, volumes usually diminish during their formation and when breakouts occur, volume expansion confirms the pattern.Descending triangle chart patterns should contain at least two or more similar lows, not exactly equal but roughly the same, to form the lower horizontal trendline. To form the downward sloping trendline, at least two lower highs are required. Entries would be initiated below the support line and above the resistance line.
As seen in “As good as GOOG” (below), the stock formed support at $553 twice from November 2010 to March 2011. Google gradually started making lower highs, which signified that sellers were gaining control. Then, on April 15, Google announced its first-quarter results, which were below street expectations, and the stock tanked almost 8%. The stock broke its support of $553 with a huge gap down. Having a double bottom at the support level increased the strength of support and significance of its breach.
Great expectations
Triangles, like all other chart patterns, are not perfect. Most traders allow for a 1% to 3% move outside of the pattern, even with an expansion in volume, before the signal is considered valid.Despite the possibility for false breakouts, which can be guarded against with a conservative entry strategy, triangle chart patterns are one of the more reliable price-based stock market trading techniques. However, triangle breakouts should be confirmed using volume, with other indicators (such as moving average convergence-divergence and stochastics oscillators) helping guard against false entries. In addition, it’s always important to protect your downside with a stop loss.
The eternal forces of supply and demand never rest, and the most immediate measure of that struggle is price itself. For equity traders, price patterns offer the most straightforward interpretation of the message prices are striving to deliver. Triangles are one of the more effective tools for that purpose.
Information on these pages contains forward-looking statements that involve risks and uncertainties. Markets and instruments profiled on this page are for informational purposes only and should not in any way come across as a recommendation to buy or sell in these assets. You should do your own thorough research before making any investment decisions. FXStreet does not in any way guarantee that this information is free from mistakes, errors, or material misstatements. It also does not guarantee that this information is of a timely nature. Investing in Open Markets involves a great deal of risk, including the loss of all or a portion of your investment, as well as emotional distress. All risks, losses and costs associated with investing, including total loss of principal, are your responsibility. The views and opinions expressed in this article are those of the authors and do not necessarily reflect the official policy or position of FXStreet nor its advertisers.