Minimizing loss: Run-length trade statistics
|By Michael Gutmann
An enormous amount has been written about the psychology of trading. Indeed, many experienced traders claim that trade strategy and execution are less important than managing the emotions of trading. This doesn’t mean, however, that you’ll find all the answers from your psychiatrist’s couch. Instead, we can embark on a critical journey to understand the basic statistics of trading — for example, the frequency and duration of winners and losers — to better navigate and anticipate the ups and downs of the trading endeavor.
Consider a simple automated intraday strategy that fades the previous day’s highs and lows. The strategy runs against the Chicago Mercantile Exchange’s E-mini S&P 500 futures contract (ES); it could be applied to a variety of assets. A long position is taken when the market retraces to the previous day’s low; a short position is taken when the market retraces to the previous day’s high. Logic is added to handle opening gaps above and below these levels, and trades are not taken when the underlying stock market, as measured by New York Stock Exchange breadth data, is either too bullish or bearish, indicating a trend may be in progress. Initial stop-loss is set at 0.5% of contract value and trailing stops are used if a 0.5% contract profit is realized.
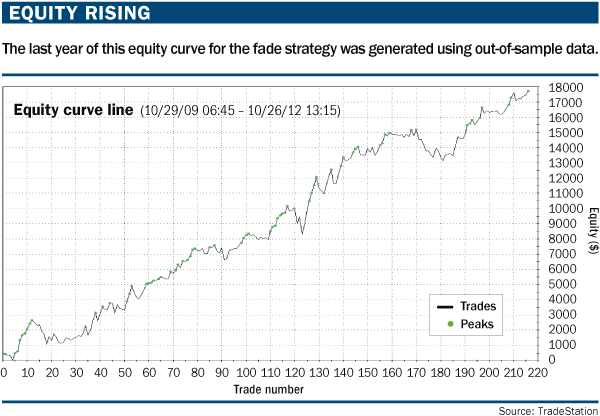
“Equity rising” (below) gives the most recent three-year performance of the strategy, trading a single ES contract, where the intraday margin requirement typically is $500. For the most part, this is in-sample data and must be viewed as such; however, the equity curve’s last year was collected as an out-of-sample test and arguably is a reasonable reflection of the strategy’s efficacy.
Measuring the pain
Given that trade psychology is so important, it should play a role when this strategy is put online against a live account. “Performance report” (below) provides some of the typical performance detail used to evaluate a strategy and manage it once it goes live. Of interest are the maximum number of consecutive losing trades, because a trader will want to know the extent of the pain that must be endured in running a strategy; or more objectively, how many losing trades to expect and endure before prematurely giving up. In the case of the simple fade strategy, over the last three years, six losing trades in a row would have to have been endured to realize the equity curve. Is the trader prepared for this?
To answer that question, it is helpful to know basic winning and losing run-length statistics. For example, if a trade strategy has a per-trade winning percentage of X% (say 50%, or winning half the time), and the strategy is run for N number of trades, how many losing trades in a row are expected?
We can provide some basic background to answer the winning/losing runs question. Knowing the basic statistics of trade winning and losing runs will help prepare the trader for the emotions of executing a strategy, as well as provide objective measures for when either to stay with it or throw in the towel.
Probability play
Trade win-loss statistics can be analyzed using ideas from binomial trails and distributions, similar to the way we count heads or tails when flipping a coin. A fair coin will have a 50% chance of a head or tail with any one toss, while trading typically will have an uneven win-loss percentage averaged over a series of trades. For example, our sample fade strategy has an approximate 60% winning percentage based on its performance history, meaning we expect to see six of 10 trades closed for a profit. We consider a trade strategy executed over a number of trades similar to counting the number of heads or tails realized over a number of tosses.The well-known counting formula is:
The above equation gives the probability of realizing exactly r successes in N trials, where P is the probability of success of any one trial. For example, the probability of two heads (heads = success) from four tosses of a coin, where p equals 50% or ½, is:
This kind of counting formula is a practical tool for all systematic traders, and there are many varieties that can be applied to trading. However, when the goal is to determine the number and length of winning or losing trade runs over a trading period, a closed-form solution, or formula like the above, is difficult to determine. In this case, computer simulation can be used to model a large number of trades and count the wins and losses.
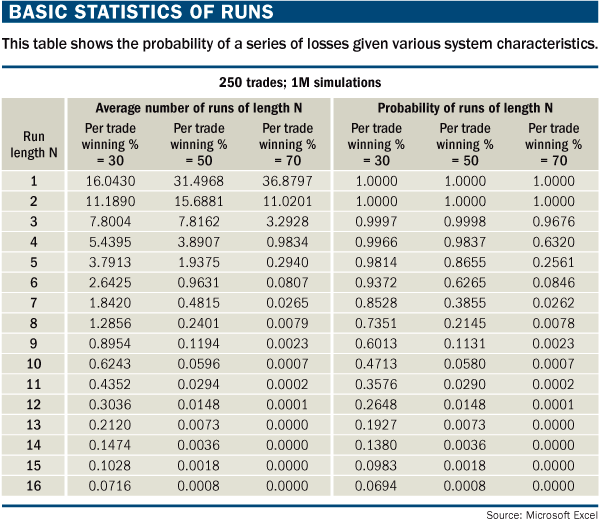
“Basic statistics of runs” (below) gives the average number and probability of various run lengths over 250 successive trades, using per-trade winning percentages of 30%, 50% and 70%. The 250 figure assumes one trade per day in a 250-trading-day year. The three winning percentages offer a range of trade execution, where 30% might represent conservative swing trading and 70% aggressive scalping. The 50% rate represents even win-loss trading similar to flipping a coin. The data were generated from 1 million simulations of the 250 trades using software random number generation.
The basic run statistics data show, for example, that over 250 trades, and with a per-trade win-loss percentage of 50%, the trader must endure six losses in a row 62% of the time. If we assume swing trading with a lower per-trade winning percentage of 30%, then the trader must endure eight losing trades in a row 73% of the time. About 98% of the time (really in every case), there will be five losses in a row and, on average, a five-loss run will occur 3.7, or almost four, times over 250 trades. The active trader can study the data here to become familiar with basic run-length statistics.
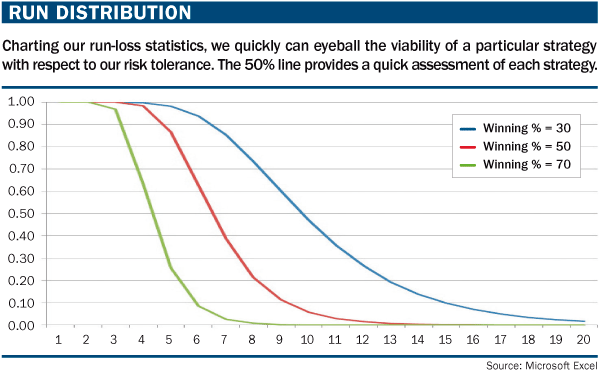
“Run distribution” (below) illustrates the probability distributions for the three per-trade winning percentages. As an example, it is informative to draw a cut-line at the 50% level to see the expected run lengths that will occur at least half the time when trading at a given per-trade winning percentage rate. (Contact the author if you would like a copy of the Windows/C++ program that generated the data.)
Trading application
We can apply the run-length statistics to specific strategies as a guide, whether discretionary or automated trading is practiced. In the fade strategy, which shows a 60% winning percentage over 216 trades, the simulation data predict an average of 0.78, or fairly close to one, run of five losing trades more than 50% of the time. That is, in the recent three-year test period of the fade strategy, half the time we should expect to encounter a five-in-a-row losing streak.Actual backtest data are consistent with this estimate, and there is no reason to pull the strategy when a losing run of five occurs at this frequency. Later, if we encounter a losing run of, say, eight trades in a row, we might retire the strategy because the simulation shows there is just a 5% chance of this occurring. A reasonable conclusion considering the unlikeliness of that occurring is that market conditions fundamentally have shifted, making the strategy obsolete.
In general, the run length statistics can be used to guide how to structure a trading program that it is consistent with a trader’s psychology, risk tolerance and expectations. There are swing trade practitioners who argue modest (25%-30%) winning trade percentages are the norm while making sure to let winners run and cutting losers quickly (see “Diary of a Professional Commodity Trader” by Peter L. Brandt, John Wiley & Sons, 2011). In this approach, the trader must realize there will be lengthy runs of losing trades. A 30% per-trade winning percentage means that approximately 75% of the time there will be a losing run of eight trades over a 250 trade cycle. If the trader finds this hard to endure, then trading with a higher per-trade winning percentage is needed. The math cannot be beaten, really.
Finally, the run-length statistics offer a clue as to why we often read about even the finest practitioners going fallow, perhaps with a sense that they have lost their touch or have somehow gotten out-of-sync with the market (see Jack Schwager’s “Market Wizards” series). In fact, what may be occurring is the inevitable losing run has been hit — from which the professional learns the importance of managing losses or is retired from the endeavor by the unrelenting nature of the market.
Information on these pages contains forward-looking statements that involve risks and uncertainties. Markets and instruments profiled on this page are for informational purposes only and should not in any way come across as a recommendation to buy or sell in these assets. You should do your own thorough research before making any investment decisions. FXStreet does not in any way guarantee that this information is free from mistakes, errors, or material misstatements. It also does not guarantee that this information is of a timely nature. Investing in Open Markets involves a great deal of risk, including the loss of all or a portion of your investment, as well as emotional distress. All risks, losses and costs associated with investing, including total loss of principal, are your responsibility. The views and opinions expressed in this article are those of the authors and do not necessarily reflect the official policy or position of FXStreet nor its advertisers.