Midyear Leading Real Estate Indicators
|Midway through the year, what do the Leading Indicators tell us? This is a strange market if you ask me – the indicators say one thing but the professionals I talk to have a little different take. Let’s start by looking at some of the most popular indicators.
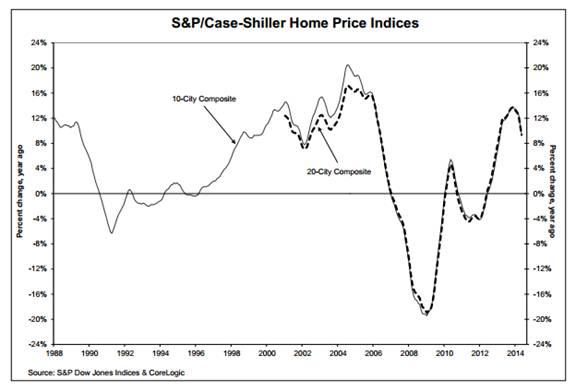
Case-Shiller Home Price Indices – a lagging indicator
The CaseShiller Index gives us a national overview of prices.
“Home prices rose at their slowest pace since February of last year,” says David M. Blitzer, Chairman of the Index Committee at S&P Dow Jones Indices. “The 10- and 20-City Composites posted just over 9%, well below expectations. Month-to-month, all cities are posting gains before seasonal adjustment; after seasonal adjustment 14 of 20 were lower.
“Year-over-year, nine cities – Las Vegas (16.9%), San Francisco (15.4%), Miami (13.2%), San Diego (12.4%), Los Angeles (12.3%), Detroit (11.9%), Atlanta (11.2%), Tampa (10.2%) and Portland (10.0%) – posted double-digit increases in May 2014. The Sun Belt continues to lead with seven of the top eight performing cities. Eighteen of 20 cities had lower year-over-year numbers than last month; San Francisco and San Diego saw their year-over-year figures decelerate by about three percentage points.
“Housing has been turning in mixed economic numbers in the last few months. Prices and sales of existing homes have shown improvement while construction and sales of new homes continue to lag. At the same time, the broader economy and especially employment are showing larger improvements and substantial gains.”
Existing Home Sales – a lagging indicator
According to the National Association of Realtors, total existing-home sales, which are completed transactions that include single-family homes, townhomes, condominiums and co-ops, climbed 2.6 percent to a seasonally adjusted annual rate of 5.04 million in June from an upwardly-revised 4.91 million in May. Sales are at the highest pace since October 2013 (5.13 million), but remain 2.3 percent below the 5.16 million-unit level a year ago.
Lawrence Yun, NAR chief economist, said housing fundamentals are moving in the right direction. “Inventories are at their highest level in over a year and price gains have slowed to much more welcoming levels in many parts of the country. This bodes well for rising home sales in the upcoming months as consumers are provided with more choices,”
This might be the “national view” but I am hearing a different story. In some areas inventory is still very low.
Distressed Property Sales
Because of the rise in home values (and overall improvement in the econonny) we see a natural progression to fewer foreclosures and short sales. In June only 11% of sales were accounted for by distressed properties, the break down was 8 percent foreclosed properties (either at the trustee sale or REO’s) and 3 percent was short sales.
This does indicate that our market is getting back to more healthy, traditional and hopefully predictable cycles.
Pending Home Sales – a forward looking indicator
Pending Home Sales are based on signed contracts not closed contracts. There was a small decline of 1.1 percent to 102.7 in June from 103.8 in May, which is 7.3 percent below June 2013. Despite June’s decrease, the index is above 100 and is considered an average level of contract activity.
All in all this data looks positive with little ebs and flows. I alluded to earlier that professionals in many areas of the country that I speak with are feeling a bit of a stagnation. There doesn’t seem to be a sense of urgency to move.
We’ll take a look at this data again after the prime selling season is over (spring/summer) to see what story that tells us.
Information on these pages contains forward-looking statements that involve risks and uncertainties. Markets and instruments profiled on this page are for informational purposes only and should not in any way come across as a recommendation to buy or sell in these assets. You should do your own thorough research before making any investment decisions. FXStreet does not in any way guarantee that this information is free from mistakes, errors, or material misstatements. It also does not guarantee that this information is of a timely nature. Investing in Open Markets involves a great deal of risk, including the loss of all or a portion of your investment, as well as emotional distress. All risks, losses and costs associated with investing, including total loss of principal, are your responsibility. The views and opinions expressed in this article are those of the authors and do not necessarily reflect the official policy or position of FXStreet nor its advertisers.