Options – Picture This (Part 3)
|This series of articles has covered the use of the Option Payoff Graph as a trade analysis tool for option trades. We’ve used an example that involved selling (short) put options on GE stock.
When the series began several weeks ago, it appeared that GE was likely to hold above the $27 level through the February options expiration date. Using this trade analysis tool, we investigated selling puts at the $27 strike.
Below is the way GE’s stock looked as of this writing on February 10. This final article in this series will examine how the option payoff graph depicts possible changes in market expectations, otherwise known as Implied Volatility.
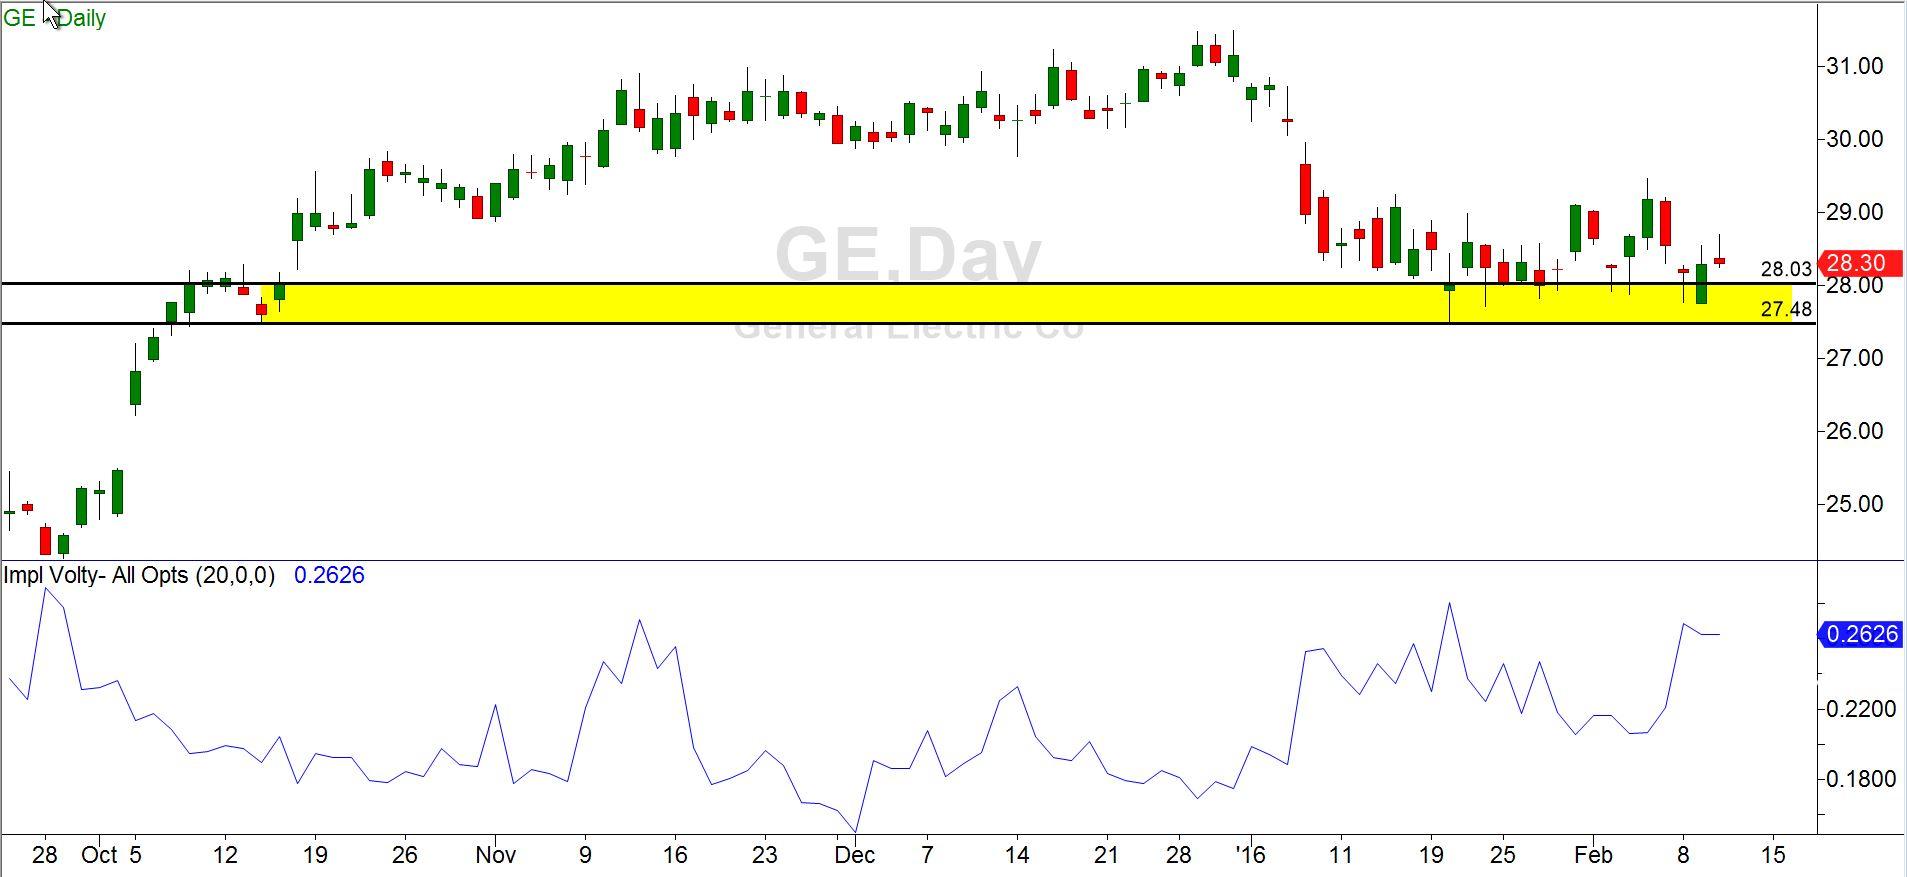
I should say here that the bullish case for GE did not look nearly as strong on February 10 as it had when we first suggested it on January 19. At that time, we sold the $27-strike puts for $60 per contract, expecting GE to rally. GE did in fact hold above our $27 strike price, and the February puts were then just $19 per contract, showing a nice profit of $41 per contract.
But the stock did not take the kind of bounce that we were hoping for. This is not surprising since the general market direction has been very bearish. Nevertheless, for the sake of continuity we’ll finish out our example with this same stock, re-setting it to use the March $27 options.
As of February 10, the March puts at the $27 strike price were around $61 per contract. They had 36 days until expiration. For a short put position, the following option payoff graph shows the projected P/L at four different dates – 0 days to go, 12 days, 24 days and 36 days.
Option Payoff Graph – Volatility constant
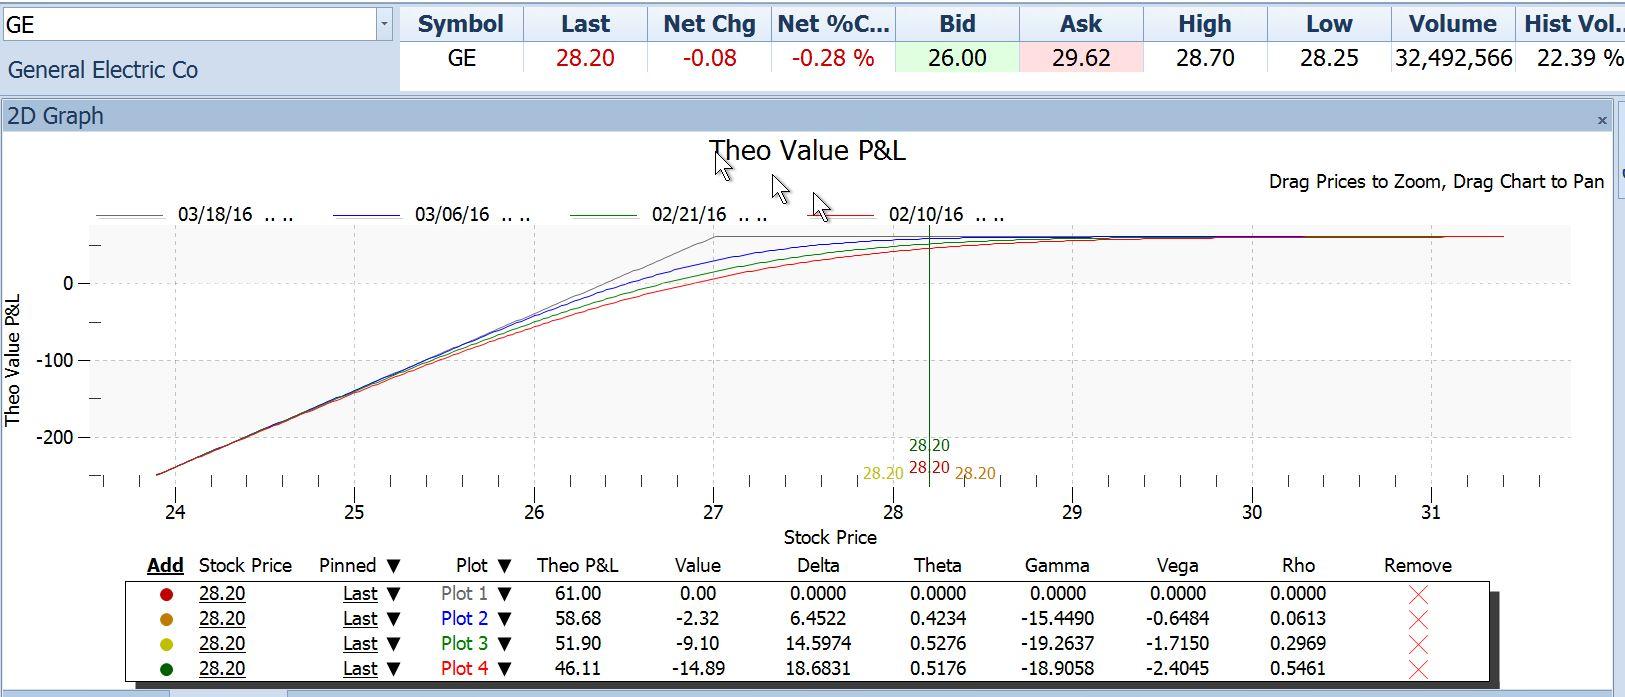
Let’s take a look at the four different colored lines above for our trade analysis. They demonstrate how we can visualize the profit picture at different dates in the future, at any price for the stock. The red line is how things looked on Feb 10, with 36 days to go. The green line is how they would look 12 days later, the blue line 12 days after that and the gray line as of the expiration date on March 18.
All of those lines were drawn assuming that the expectations of volatility for the stock remained unchanged. This is the default assumption. But we also would like to know how things would be affected by a change in expectations. What if option buyers decided that they now believed the stock would move 50% faster than they had previously thought? How much more would they be charging us to buy those options back in that case? And what if, on the other hand, they expected the stock to move 50% slower than they had thought? How much cheaper would those options be?
The payoff graph can help us with this part of the trade analysis as well. By working those changes in assumptions into the payoff graph, we can see the subtle differences in the projected outcome. Compare the payoff graphs below to the first one:
Option Payoff Graph – Volatility reduced by 50%
Notice above that all of the curved lines are higher at every stock price – a reduction in volatility after we have sold puts and pocketed the money increases our profit.
Option Payoff Graph – Volatility increased by 50%
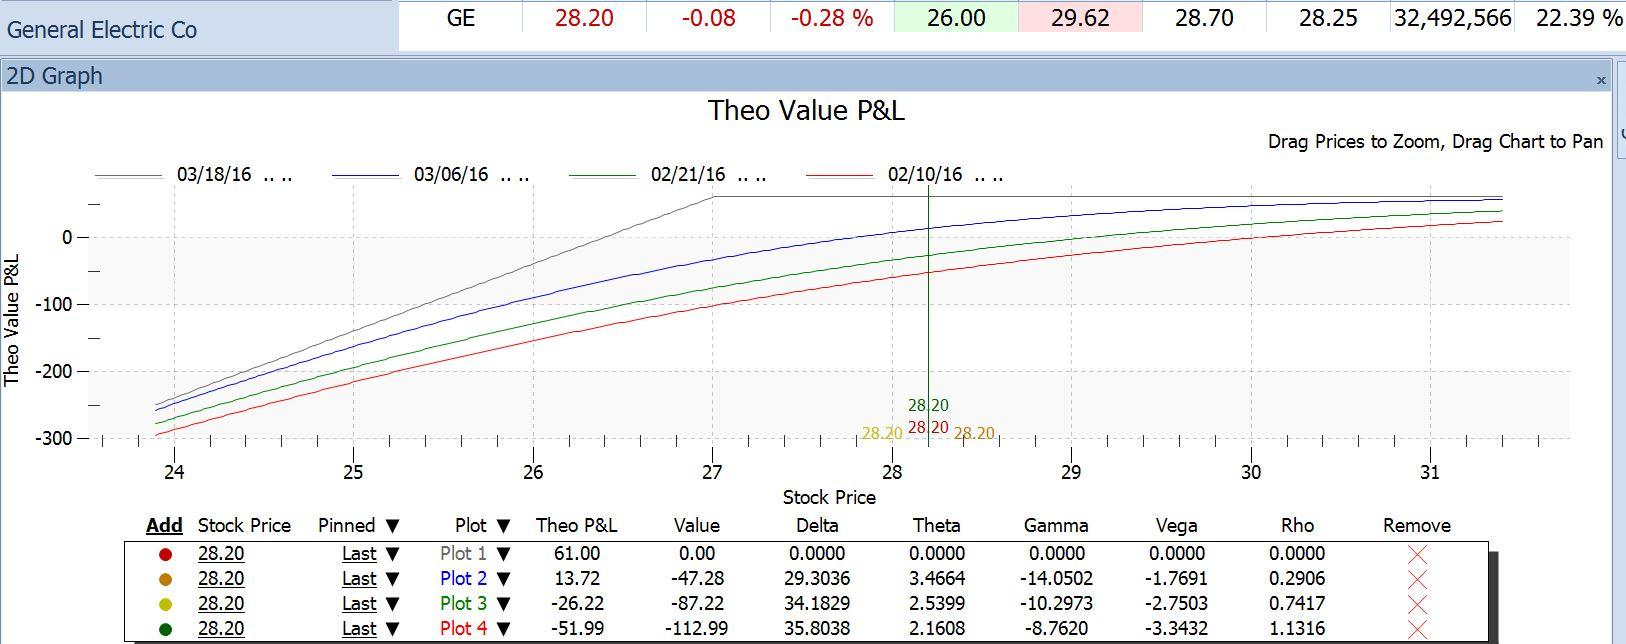
Here, on the other hand, we see how an increase in volatility would reduce our profits at any date and stock price. That is because if volatility increased, the price we might have to pay to buy the option back and terminate the trade would increase, reducing our profit.
If we had a strong expectation that the level of implied volatility would either rise (because it was abnormally low) or fall (because it was abnormally high), then being able to model those expected changes would allow us to quantify the effect.
In this series of articles, we’ve shown that the option payoff graph can be used to forecast the effect on any option position for all three of the main forces that affect them: stock price, time and volatility. For option traders, the effort spent learning to use this invaluable trade analysis tool is well worth it.
Information on these pages contains forward-looking statements that involve risks and uncertainties. Markets and instruments profiled on this page are for informational purposes only and should not in any way come across as a recommendation to buy or sell in these assets. You should do your own thorough research before making any investment decisions. FXStreet does not in any way guarantee that this information is free from mistakes, errors, or material misstatements. It also does not guarantee that this information is of a timely nature. Investing in Open Markets involves a great deal of risk, including the loss of all or a portion of your investment, as well as emotional distress. All risks, losses and costs associated with investing, including total loss of principal, are your responsibility. The views and opinions expressed in this article are those of the authors and do not necessarily reflect the official policy or position of FXStreet nor its advertisers.