Strategy Variety – Double Vertical Spread
|I love options for the tremendous variety of strategies they offer. One of the more creative ones is the Double Vertical spread. This strategy is appropriate when you have a strong bullish or bearish opinion on a stock or ETF; you want a limited-risk trade; and you want a trade that will not be affected too much by changes in volatility.
There are other strategies that could be used in this same situation, such as a directional butterfly. But I like the double vertical when I believe that there is a lot of potential for movement in my direction. Here is an example:
On February 9, USO, the exchange-traded fund that tracks the price of crude oil, was at $19.64. It’s chart appeared like this:
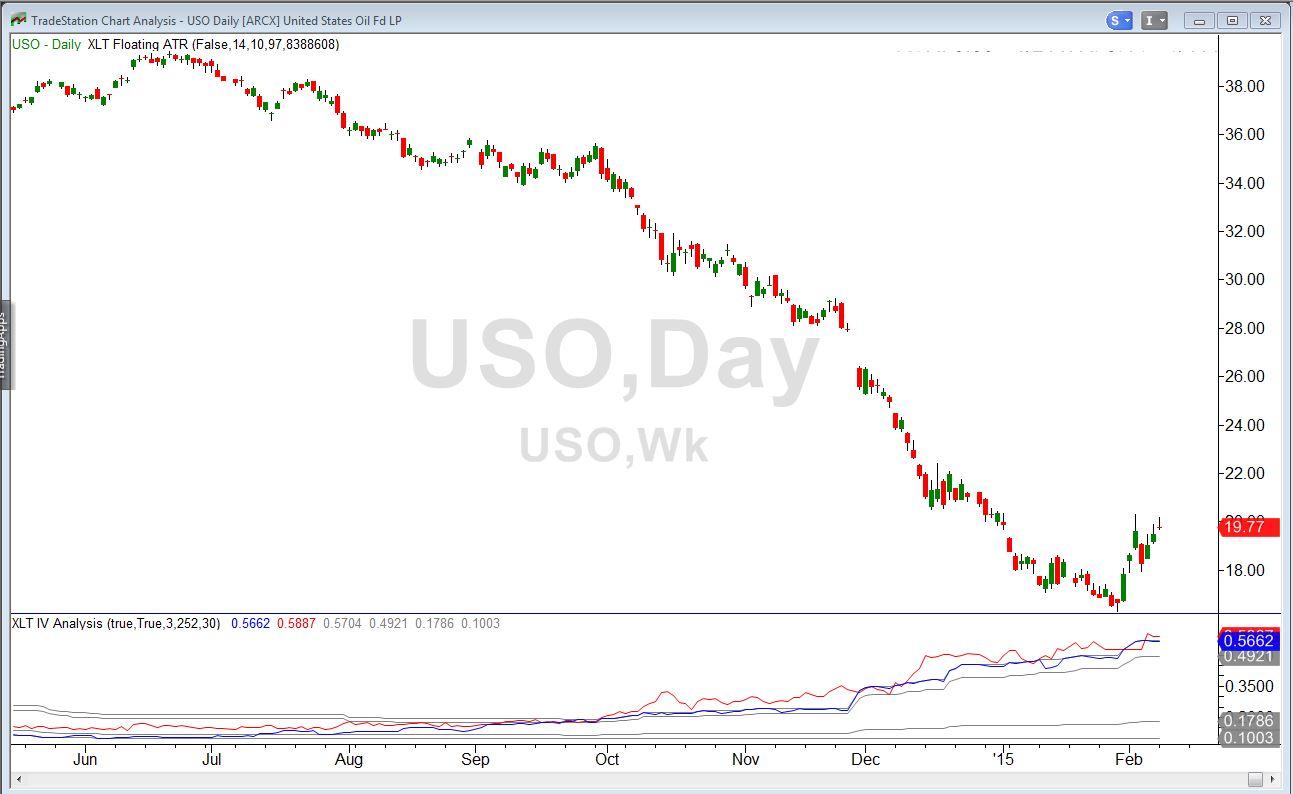
It looked as though the downtrend might have been broken. Prices had a very long way to go on the upside, even to get back to the $28 mark from where the big December breakdown occurred. Implied volatility, at over 56% was very high, meaning that options were expensive.
A double vertical includes two separate bullish vertical spreads. A Bull Put spread is put on at strike prices below the current price. This will generate a credit since the higher strike put will bring in more than the lower strike put costs. As long as the stock remains above the strike prices this credit will be ours to keep.
In this case, the May 18/15 bull put spread, consisting of a short put at the 18 strike and a long put at the 15 strike, could be sold for a net credit of $77 per contract (selling the 18 put for $1.19 and buying the 15 put at $.42). If USO closed on the May 15 expiration date at any price above $18 per share, both of these puts would be worthless and this $77 would be clear profit.
The second part of a double vertical spread is a bull call spread at higher strike prices. These strikes are selected so that the cost of this spread is less than the credit received for the bull put spread while still being within a price range that the stock might exceed.
Here, the May 22/25 bull call spread could be purchased for $62 per contract (paying $1.09 for the 22 calls and receiving $.47 for the 25 calls). This part of the trade could only make money if USO climbed considerably above the $22 long call strike. But it could be worth as much as three dollars per share ($25 – $22), which would be $300 per contract if USO did make it as high as $25. This seemed well within the realm of possibility. And if that bull call spread did payoff, that would also mean the bull put spread, at the lower strikes, was a winner.
The bull call spread consumed $62 of the $77 credit received for the bull put spread. Thus the net cost of the whole trade was a credit (money taken in) of $77 – $62 = $15.
Our best case was a total profit of $315. This included the $300 maximum value of the bull call spread plus the $15 net credit for the entire trade. This maximum profit could also be calculated in a different way by figuring the maximum profit of the two spreads as standalone trades. The maximum profit on the bull put spread was the $77 credit received for it. The maximum profit (not value) on the bull call spread was its $300 maximum value, less its original cost of $62, or $238 net. $238 plus $77 is also $315.
Below is the option payoff chart for this trade. Notice its unusual shape. The green line, representing P/L if held until expiration, has a rising segment between stock prices of $15 and $18, which are the two strikes in our bull put spread. It then flattens out (with a profit of $15) up to a stock price of $22. From there it rises again until finally flattening out at a stock price of $25. The $22 and $25 levels are the strike prices in our bull call spread.
The three curved lines represent the profit or loss on this trade at different dates before expiration: today (blue), one month out (magenta) and two months out (red). The close grouping of the curved lines shows that the trade is not affected much by the passage of time up until two months out.
The two vertical lines are at the current price of $19.64 and a stop-loss price at $16.81, described below.
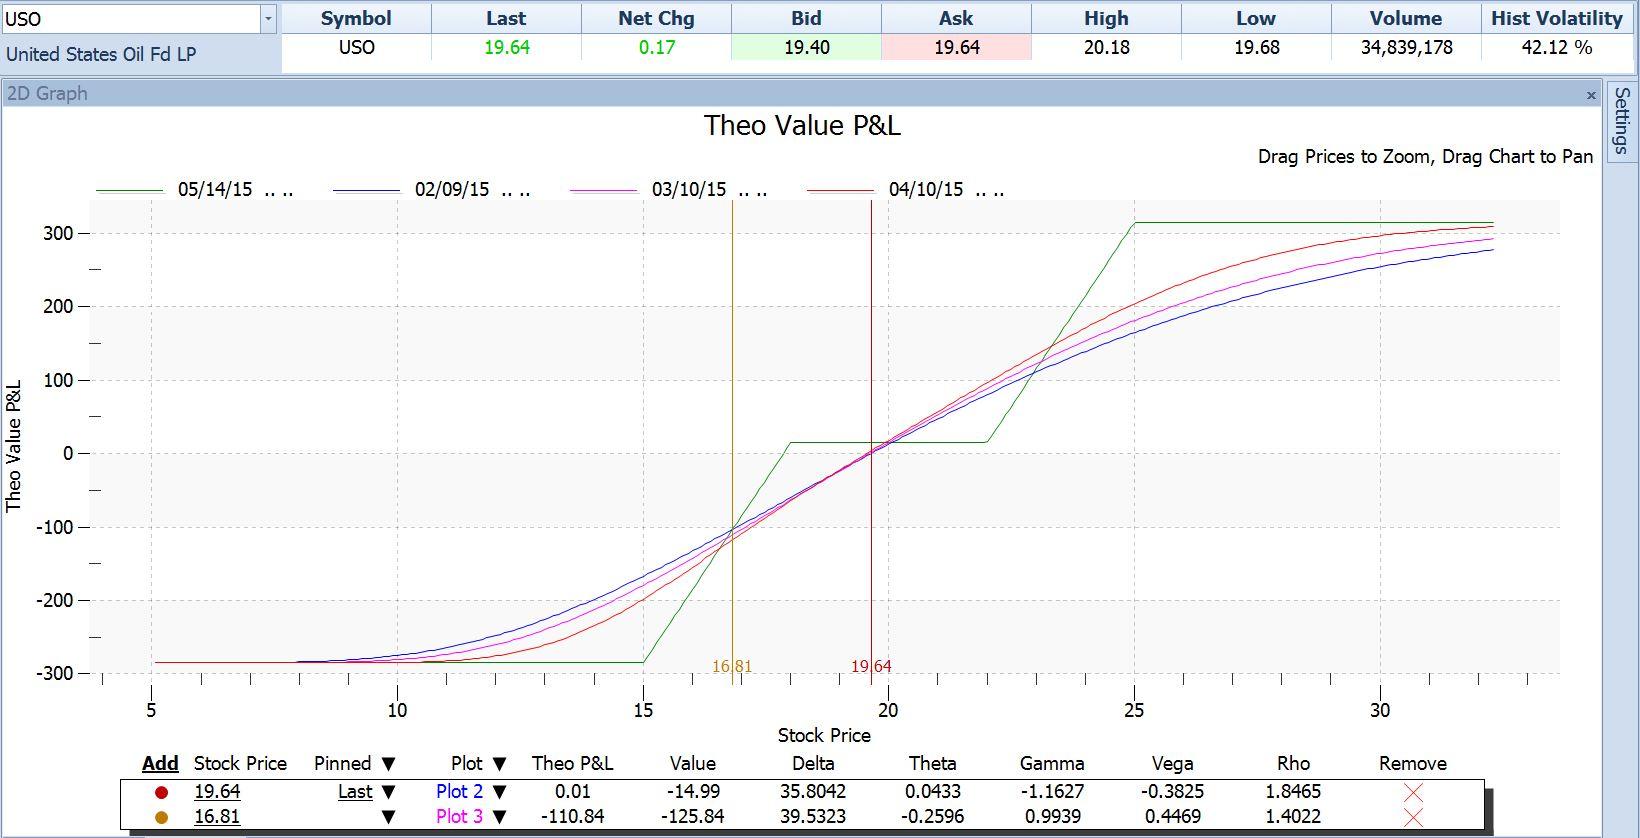
Once this trade was in place we would put in a stop-loss order to unwind it (close out all parts of it) if USO dropped below $16.81, which was the top of a demand zone representing the all-time lows made in January. Our loss at that price would be about $110.84, as shown in the second line of the table above. So our reward-to-risk ratio was $315.00 / $110.84, or a little less than three to one.
Our break-even price on this trade would be the $18.00 short put strike less the $.15 per share credit received, or $17.85. At any price above that at expiration we would have a profit.
Even though the trade originally generated a credit of $.15 per share or $15 per contract, it still required us to consume buying power (margin), as credit trades always do. When a trade generates a credit it is always possible that unfavorable price movement of the stock will cause us to have to give back all of that credit plus more. In this case, if USO dropped below the $15.00 strike price and stayed there until expiration and we did nothing but watch it, the bull put spread would cost $300 to exit. The $18 put would be assigned so we would have to buy 100 shares of USO for $1800. We would then exercise our $15.00 put and push that stock right out again in exchange for $1500 for a net outlay of $300. And in that case, with USO below $15 per share it would, of course, also be below the $22 strike price of our long call, so the 22/25 bull call spread would be worthless.
That $300 maximum outlay less the $15 net credit originally received is a net of $285 maximum loss on the entire trade. This would be the buying power needed. We don’t get any reduction of our buying power requirement by putting in the stop-loss order, even though that should limit our loss to about $110. This is because it is possible that USO could simply close one night above $16.81 and then open the next day below $15 and we could let it sit until expiration. Not likely, but possible.
So it comes down to this:
- If USO remains at any price above our stop-loss of $16.81, we’d stay with this trade; otherwise we’d bail out as soon as our stop was violated.
- If USO is between $16.81 and our break-even of $17.85 at expiration, we will have a small loss somewhere between zero and $110.84.
- If USO is anywhere between $18 and $22 and we hold until expiration, our profit would be the $15 net credit received. If we exit earlier it will be higher.
- If USO rises above $22, then our profit will increase beyond the $15.00 net credit.
Next week we’ll check in on this trade and talk more about how to manage it in its last month.
Information on these pages contains forward-looking statements that involve risks and uncertainties. Markets and instruments profiled on this page are for informational purposes only and should not in any way come across as a recommendation to buy or sell in these assets. You should do your own thorough research before making any investment decisions. FXStreet does not in any way guarantee that this information is free from mistakes, errors, or material misstatements. It also does not guarantee that this information is of a timely nature. Investing in Open Markets involves a great deal of risk, including the loss of all or a portion of your investment, as well as emotional distress. All risks, losses and costs associated with investing, including total loss of principal, are your responsibility. The views and opinions expressed in this article are those of the authors and do not necessarily reflect the official policy or position of FXStreet nor its advertisers.