Put Profit and Loss Rollercoaster Ride
|At the end of each article, I invite you to contact me with questions or comments, and many of you do just that. From time to time I devote a column to answering some of those here that I think will be of general interest, so here we go:
Stock Prices and Short Put Profit/Loss
I am struggling to understand price action [of the stock in relation to] my gain or loss in a sold put.
When I own a stock or futures contract, it’s simple: when price goes up from the point I bought, my gain increases that amount. When I sell a put, it was my understanding that I collect premiums until expiration (until I do something).
But what I’m seeing is a roller coaster ride between gains and losses. For example (in SIM, of course): I sold 5 SPY puts @ 195 on 8/21. Since then my gain has been at +2, -10, +22.5, +16.5, and now it is at +3.5.
What is the relationship between the gain on my put trade and price action?
First, let’s address this part:
When I sell a put, it was my understanding that I collect premiums until expiration (until I do something).
Options go up and down in value – they don’t show a steady rate of decline. You wouldn’t expect a stock that you sell short to immediately begin a steady drop. The option that you sold short doesn’t do this either. Put prices go up when stocks go down, and down when stock prices go up. Your gain or loss at any time is the difference between the price at which you sold the put, and the put’s current price.
You may be thinking of the idea that the time value in an option decays away to zero. And so it does. But that is only one of the three forces moving the option price. The other two are:
- Movement of the underlying stock
- Changing expectations (changing Implied Volatility)
These two forces are in constant action alongside the force of time decay. Each one of them can push upward or downward on the option’s value. So although time decay does diminish the value of every option every day, the movement of the stock may overcome this; and/or changing expectations may increase the option’s price more than the drop due to time decay.
The premium you collect when selling a put is the price you receive for selling it. Let’s say the November $195 put was showing a Bid price of $3.38, and an Ask price of $3.40. You could have entered a Limit order at the $3.40 bid price, and it sold at that price. You would have received $3.40 per share, or $340 per 100-share contract. That money was the premium. Your brokerage account then showed a position indicating that you were short 1 Nov 195 put. It also showed an increase of $340 in the cash balance.
At that point, you had collected all the money you were ever going to get for the put. The job now was to hold on to it.
When selecting a strike price for a short put, you identified a price that you believed was unlikely to be reached by SPY, by the time the put expired. If that turned out to be true, and SPY didn’t drop below your put strike price and stayed there until after expiration, then the put would have been worth nothing at expiration. The $340 that you had collected earlier would then be yours to keep.
Meanwhile, though, the put would have been gyrating as the stock price did, and as expectations changed. Here is a chart of SPY with the chart of a put superimposed on it:
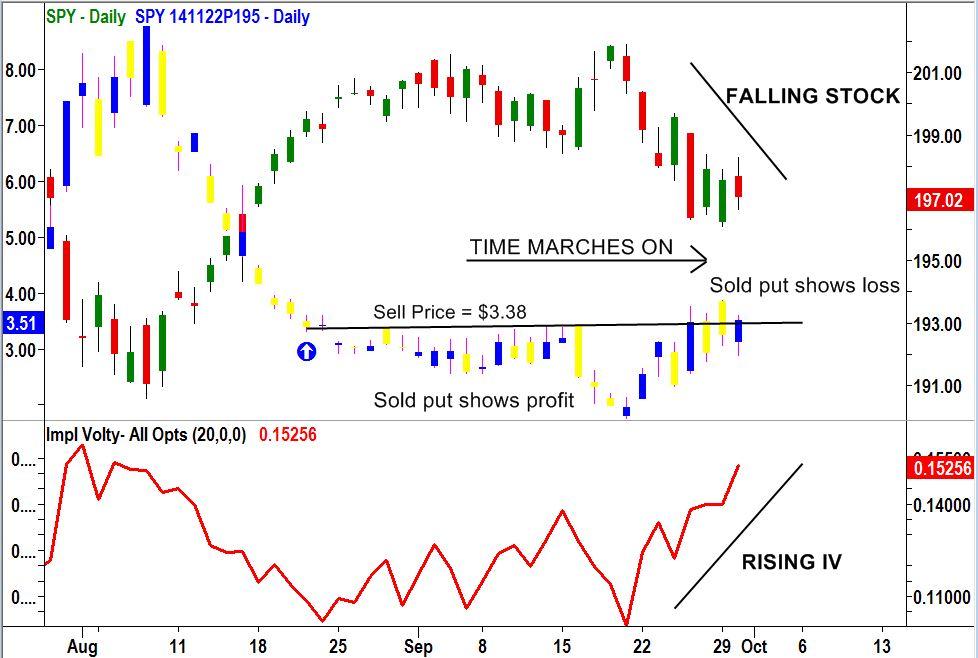
Figure 1 – SPY (red/green candlesticks, right scale) and a SPY November 195 put (blue/yellow, left scale)
In this chart, the red and green candlesticks show the recent price action in SPY. The blue and yellow ones show the price action of a November 195 put (price scale on the left side). The November $195 puts could have been sold on August 21 at $3.38 per share, as marked by the blue arrow.
At the bottom of the chart is an indicator showing Implied Volatility, or IV. When IV rises, this simply reflects the actions of option traders who paid more for a day’s worth of time value than they had previously paid. They did this because they came to believe (fear) that SPY was going to move faster than they had thought previously.
In the end – at the option’s expiration – it won’t matter any more what anyone believes or fears. SPY will either be below the put’s $195 strike price, or it will not. If it’s not, the option will be worthless. Anyone who sold it will then be relieved of their obligation to buy the SPY at $195, and their trade will have come to a successful conclusion. If SPY is below the $195 put strike, then the $195 put will have value. That value will be the amount by which SPY is below $195. If it were to be at $190, for example, the $195 strike puts would be worth $5 per share. Anyone who had sold them for $3.38 would then have a loss equal to $3.38 – $5.00 = -$1.62 per share. In the meantime, the position’s profit will fluctuate.
Assume that you had sold one of these November $195 SPY puts on August 21 at $3.38, as marked by the blue arrow. Thereafter, the price of SPY was sideways to up for several weeks, until about September 22. During this time, the price of the puts declined. This was due to time decay eating away at their value faster than stock price movement added to it. During this time, the short put position would have shown an open position profit.
On September 16-18, SPY spiked up above $201. The puts correspondingly dived, and the short put position would have showed a much bigger profit.
After September 18, there was a combination of a falling stock price (which increased the value of puts) along with rising implied volatility (also increasing the value of puts). The put prices went up; at the point where the puts exceeded the $3.38 sale price, the trade showed a loss.
On the last bar of the chart, the puts were at almost the same value as the $3.38 at which they were originally sold. The time decay that had occurred in the intervening forty days, had just about exactly offset the effects of the $2.50 drop in the stock price, and the 5-percentage-point increase in implied volatility (from about 10% to about 15%).
From this point forward, all three of these forces would continue to move the price of the puts. In the end, if SPY were to remain above $195 until November 21, the short puts will still expire worthless. They will have paid off by the $3.38 per share for which they were originally sold. If not, the position could have a loss.
So yes, the amount of profit or loss in a short put position can go on a roller coaster ride. Short options are not a CD that accrues interest steadily from one day to the next. They are a calculated risk. I hope that this example helps you to understand the relationship between the stock price and the put position profit.
Information on these pages contains forward-looking statements that involve risks and uncertainties. Markets and instruments profiled on this page are for informational purposes only and should not in any way come across as a recommendation to buy or sell in these assets. You should do your own thorough research before making any investment decisions. FXStreet does not in any way guarantee that this information is free from mistakes, errors, or material misstatements. It also does not guarantee that this information is of a timely nature. Investing in Open Markets involves a great deal of risk, including the loss of all or a portion of your investment, as well as emotional distress. All risks, losses and costs associated with investing, including total loss of principal, are your responsibility. The views and opinions expressed in this article are those of the authors and do not necessarily reflect the official policy or position of FXStreet nor its advertisers.