Options as Income Generators
|One of the greatest things about options is that they can be used for so many different purposes. One of those is to generate income in a relatively conservative manner. That may not be exciting compared to some other modes of trading. But how excited do we really want to be about our IRA money? Even (sane) professional day traders don’t day trade their entire net worth.
Some option strategies are commonly used for generating income. The best known is the covered call, where an investor sells out-of-the-money call options on stocks he/she owns. Another is the Collar spread or collared stock, which adds protective puts to the covered call. Also popular but less widely practiced is the cash-secured short put. That the short put is a close cousin to the covered call is not widely understood, but in fact the two are very similar in risk and reward, when the same strike is selected.
This brings up a related point: aside from the covered calls, collars and short puts, several other option strategies that sell time value can be used as conservative income generators, when “tuned” for that task. This includes some strategies that are not normally thought of in this light. Here are some of the major ones:
- Debit vertical spreads
- Credit vertical spreads
- Iron Condors
- Double Calendars
All of these can be configured, based on strike selection, as limited-risk strategies that initially sell more time value than they buy – they are net short time value. The profit comes from the decay of the time value in the sold options, at a faster rate than that of the purchased options. The sold options are the anchors of these positions – the ones where the money is made. The idea is to sell those options short and watch their value disappear. The purchased options are for protection.
All of the above strategies can be used in an aggressive manner for short-term trading. How can we tune them for more conservative use?
By selecting strike prices for the short options that have a very low probability of finishing in the money. As long as those short options expire worthless, we’re in good shape. We approach this in two ways. Most importantly, we want to make sure that the strike price for our short options is on the other side of a high-quality supply or demand zone. Identifying these supply and demand zones is a skill that is taught in all of our trading classes. The basic idea is to locate a price level that was the origin of a sharp rally or drop in price, on the appropriate time scale. For the trades of the scale we need to use for this purpose, the proper scale is daily or weekly charts.
Secondarily, the strike prices we choose should be far enough away from the current stock price that it is statistically unlikely to be reached.
Most option trading platforms have some form of a probability calculator. This takes as inputs the current stock price; number of days to expiration; a volatility estimate; and two target prices. It then gives the probabilities of the underlying price being below, in, or above the range between the two targets at expiration. If your platform doesn’t have such a calculator, there is a rudimentary free one in excel form here: http://investexcel.net/probability-of-a-successful-option-trade/
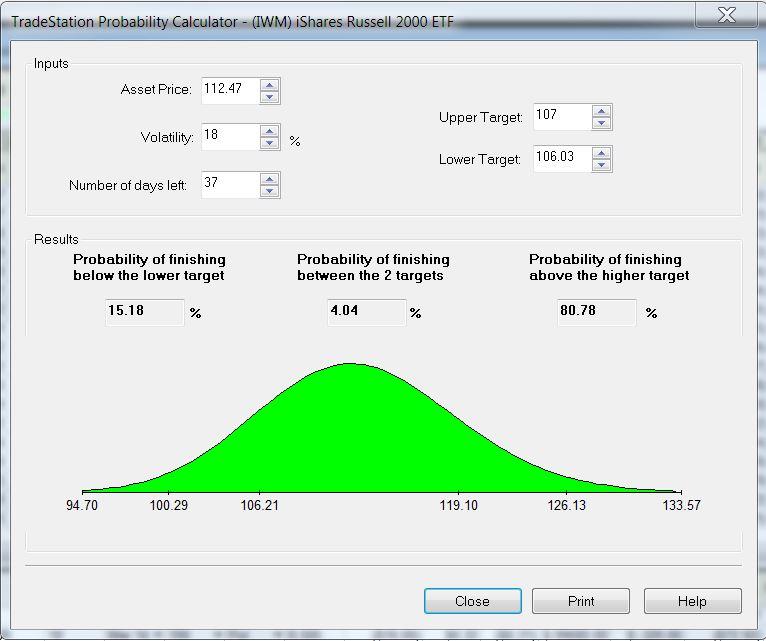
The one I use is the one in my trading platform, which is from Tradestation. Here’s an example.
On February 12, 2014, the Russell 2000 exchange-traded fund (IWM) was at $112.47. IWM, along with the rest of the market, has been in an uptrend since the market bottom in 2009. There was good demand (support) under this price at the 107-109 level. IWM’s implied volatility was quite high at 18%, compared to the historical volatility, which has ranged from 8-21% over the last year. This provided an opportunity for an income-generating trade based on selling puts below the $107 level. One alternative would have been simply to sell the March 107 puts, at $.97. This would have provided a return of $.97 per $107 invested for the 37 days, which works out to a 9% annualized rate of return.
What were the chances of making money on this trade?
First, we have to calculate at what price we would break even. The probability of profit then would be the probability of IWM finishing above that break-even level at the expiration date, 37 days away.
For puts, the formula for the break-even price is the strike price less the credit. Here that is ($107.00 – $.97), or $106.03. If IWM finished at that price or higher, we would make a profit. Below that, we would have a loss. Our loss was potentially unlimited.
The probability calculator yielded these results:
The probability of IWM finishing below 106.03 (the “lower target”) in 37 days was calculated at 15.18%. That means, of course that the probability of not finishing below that level was 100% – 15.18% = 84.82%. So that indicated a probability of about 85% of breaking even or better.
As the “upper target” for the calculation, I used the $107 put strike price. If IWM finished above that level, we would make the maximum profit on this trade, with the puts expiring worthless. The indicated probability was 80.78%.
So according to the probability calculator, this trade had an 81% chance of making the maximum profit, and an 85% chance of breaking even or better.
Our 107 put strike appeared both statistically and technically sound. The only fly in the ointment was that potentially unlimited loss.
To address this, we could have done a couple of different things. First, we could have sold puts at a lower strike price. The 103 puts, below the next support level, could be sold for $.50, returning an annualized 4.8%. Their probabilities for maximum profit and for breakeven or better were 94% and 99%, respectively. The probability of loss was very small, but still real. In a disastrous downturn, our maximum loss was still technically unlimited.
If we wanted to be even safer, we could have turned this into a different strategy – a bull put spread. Using the 103 puts as the short side (selling these at $.50), we could have bought the 98-strike puts for $.24. This left a net credit of just $.26. Although buying this “insurance put” reduced our maximum profit, it also dramatically reduced our risk, as well as our capital requirement. With the 98-103 put spread, our maximum loss was cut from unlimited to $4.76. Like any credit vertical spread, the maximum loss is the spread between the strikes (103 – 98 = $5), less the net credit (.$26). Since this maximum risk would also be our margin requirement, our return of $.26 was now on an investment of $4.76. This works out to an annualized rate of return of over 50%. The probabilities for maximum profit and for break-even or better were still 94% and 99%, respectively, but with a higher rate of return.
Note that the increased return and decreased dollar risk on the bull put spread vs the short put is not completely free. It was still possible that we could lose that $4.76. That would occur if IWM did finish below $98 in March, and we held on all the way down. The probability calculator indicated a probability of IWM finishing below 98 at .81%. Unlikely but not impossible. With the short put, we would have the option to allow IWM to be put to us at the 103 strike, and hold on to it waiting/hoping for it to recover. With the bull put spread, we have no such option.
In summary, we can use multiple strategies to generate income in a manner that has a low probability of loss. With judicious selection of strike prices and attention to probabilities, we can tune our strategies to produce a combination of risk and return with which we are comfortable.
Information on these pages contains forward-looking statements that involve risks and uncertainties. Markets and instruments profiled on this page are for informational purposes only and should not in any way come across as a recommendation to buy or sell in these assets. You should do your own thorough research before making any investment decisions. FXStreet does not in any way guarantee that this information is free from mistakes, errors, or material misstatements. It also does not guarantee that this information is of a timely nature. Investing in Open Markets involves a great deal of risk, including the loss of all or a portion of your investment, as well as emotional distress. All risks, losses and costs associated with investing, including total loss of principal, are your responsibility. The views and opinions expressed in this article are those of the authors and do not necessarily reflect the official policy or position of FXStreet nor its advertisers.