How High Can it Go?
|Traders and investors in the Indian equity markets have been enjoying watching as prices have been breaking to all-time highs. Of course the big question in everyone’s mind is where will this bull run end and is there anything I can do to protect my capital when it does? While no one can predict exactly where this price movement will reverse since there is no supply level above to signal this, there are some tools that traders can use to identify when the bullish pressure has subsided and therefore marked the time for profit taking in your portfolio.
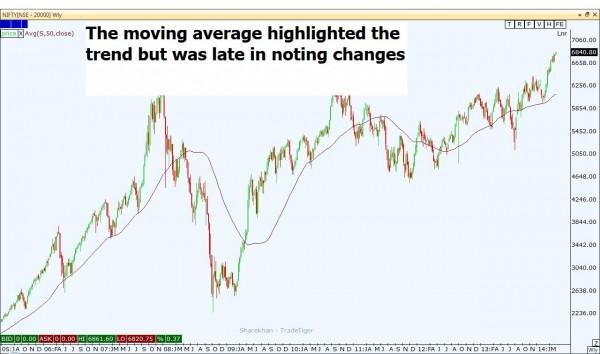
One of the most common methods is to use a moving average on your chart. The average summarizes the past trend and momentum and when prices start breaking down below it, you have likely seen the end of your trend. There are two problems with using moving averages. First, they are lagging and give very late signals. Secondly, since they are lagging, you are likely to have given back some profits you have made in the previous trend before you exit.
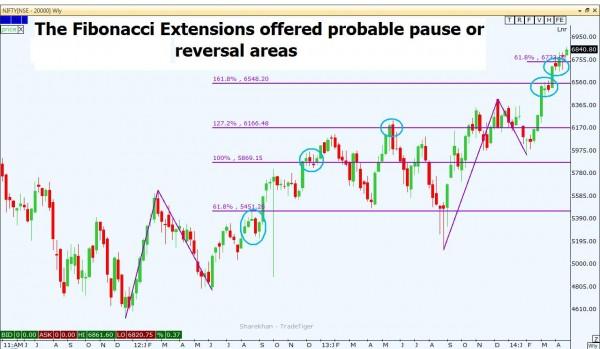
To reduce the lag and hopefully exit with more profits, many traders will look to advanced technical analysis tools such as the Fibonacci Extension tool. This uses the Fibonacci numerical sequence to project probable price points in the future where price may turn. The problem is that the price may only use these areas as pausing points rather than reversal areas and you could be exiting prematurely.
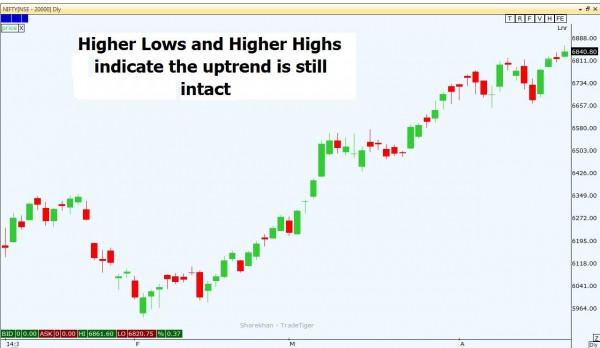
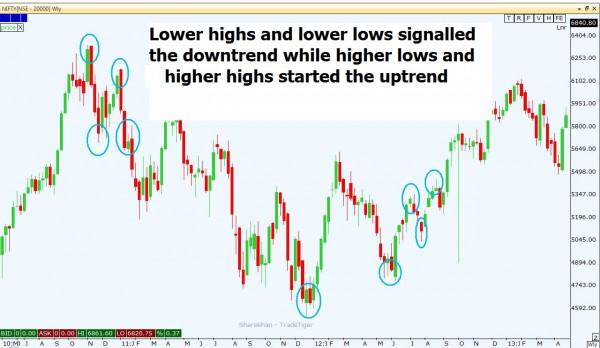
Price is usually the best indicator. Using the definition of a trend can help you identify when the trend is reversing and action is needed on longer term trades and positions.
Again you can see that using this method will not necessarily get you out with the greatest profit but it will protect your money against a large drawdown. Perhaps a combination of the above methods would be a better plan for your trading and investing. To learn more on how to identify market turning points and timing these turns, join us at one of our courses at Online Trading Academy today.
Information on these pages contains forward-looking statements that involve risks and uncertainties. Markets and instruments profiled on this page are for informational purposes only and should not in any way come across as a recommendation to buy or sell in these assets. You should do your own thorough research before making any investment decisions. FXStreet does not in any way guarantee that this information is free from mistakes, errors, or material misstatements. It also does not guarantee that this information is of a timely nature. Investing in Open Markets involves a great deal of risk, including the loss of all or a portion of your investment, as well as emotional distress. All risks, losses and costs associated with investing, including total loss of principal, are your responsibility. The views and opinions expressed in this article are those of the authors and do not necessarily reflect the official policy or position of FXStreet nor its advertisers.